Full Report
The numbers behind GoDaddy Inc.: as-reported financial statements and company metrics for FY2021–FY2025, traced to the source filings, opened with the share-price history those statements have to justify. Every linked figure opens the exact page of the filing it was printed on, with the statement row highlighted. Amounts in US$ millions unless noted.
Reading notes: Display units are US$ millions, per the filings' units line 'In millions, except shares in thousands and per share amounts'. Diluted share counts are shown in millions (filings print them in thousands). Each fiscal year is cited to that year's own Form 10-K primary column, except: (a) the FY2021 Applications and commerce / Core platform revenue split, which GoDaddy first reported under the current two-segment structure in the FY2022 10-K (the FY2021 10-K still used the legacy Domains / Hosting and presence / Business applications product lines), so FY2021's revenue-component citations point to the FY2022 10-K; and (b) FY2024 KPI figures, cited to the FY2025 10-K comparative column. Balance-sheet equity is the filings' bottom-line 'Total stockholders' equity (deficit)' (including non-controlling interests where present: FY2021 83.2 vs 81.7 attributable, FY2022 (329.3) vs (331.8), FY2023 62.2). FY2024-FY2025 had no non-controlling interests. The standardized data feed reports equity attributable to GoDaddy Inc.; the small differences are non-controlling interests, not restatements. Net income on the income statement is 'Net income attributable to GoDaddy Inc.'; net income on the cash-flow statement is total net income before non-controlling interests (e.g. FY2023 1,375.6 vs 1,374.8 attributable).
Share Price — Full Available History — 11 Years
The stock closed at $88.92 on Jul 10, 2026 — up 345% over the window shown (+14.1% a year), trading between $20.00 and $214.35. At that close the stock trades at 14× FY2025 diluted EPS as reported below.
Source: market price feed, weekly closes, sampled from 2,836 source observations, Mar 2015–Jul 2026. Price return only, excludes dividends.
FY2025 at a Glance
Revenue (US$ millions)
Operating income (US$ millions)
Net income (US$ millions)
Diluted EPS
Source: FY2025 consolidated statements [1] [2] [3] [4]. Click any linked figure to open the filing page with the row highlighted.
Revenue by Major Product Type
| Revenue by Major Product Type | FY2021 | FY2022 | FY2023 | FY2024 | FY2025 |
|---|---|---|---|---|---|
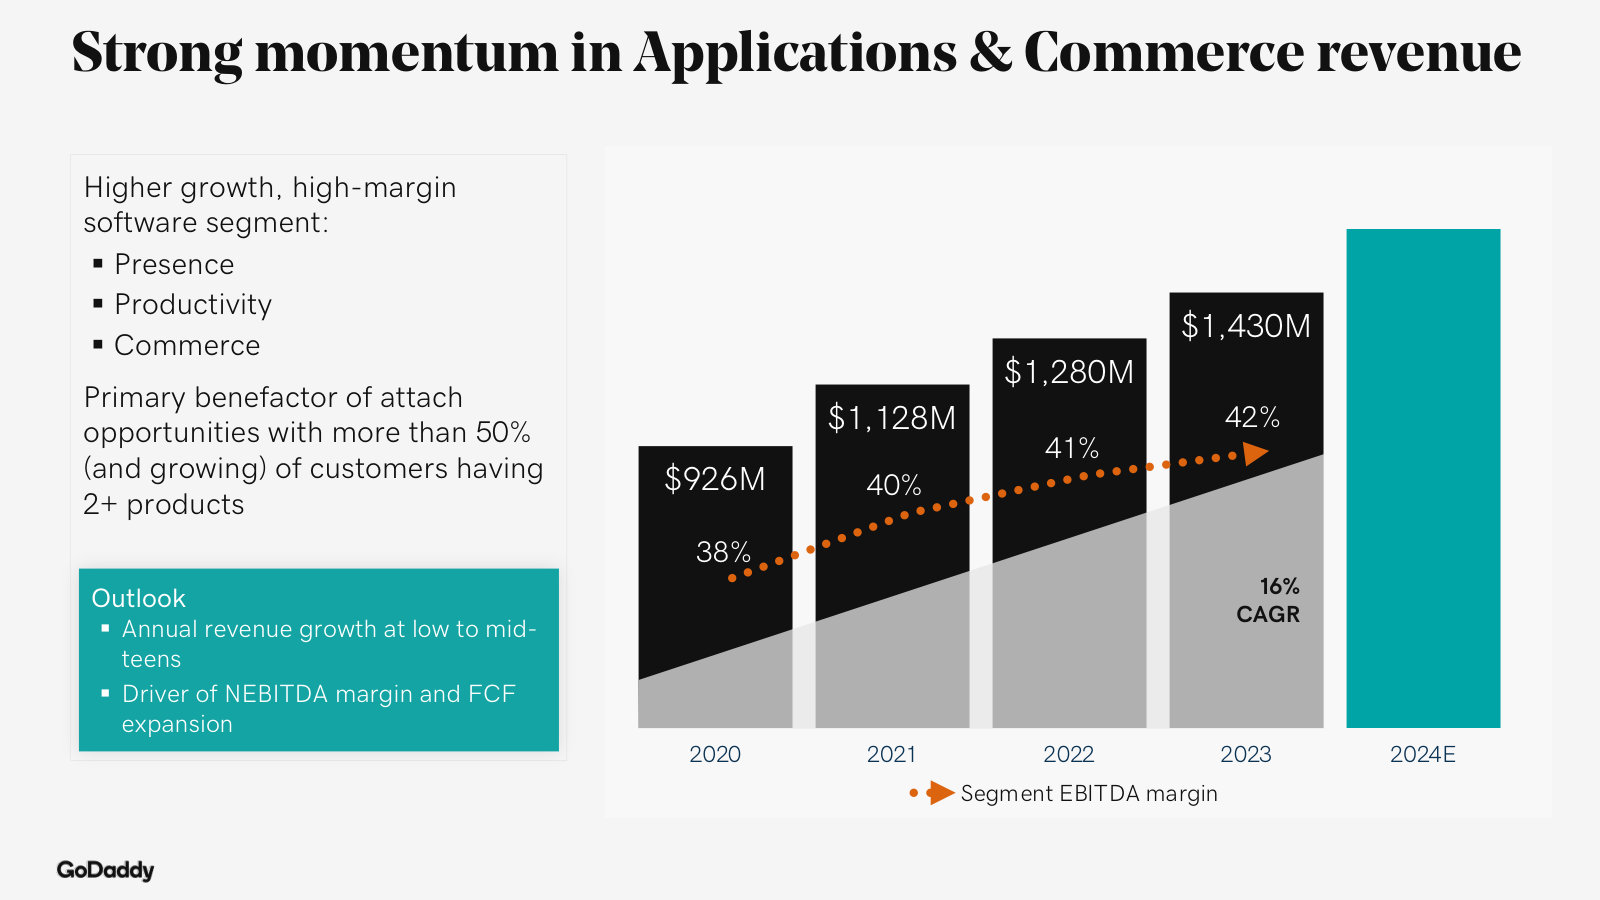
| Applications and commerce | 1,128 | 1,280 | 1,430 | 1,653 | 1,889 |
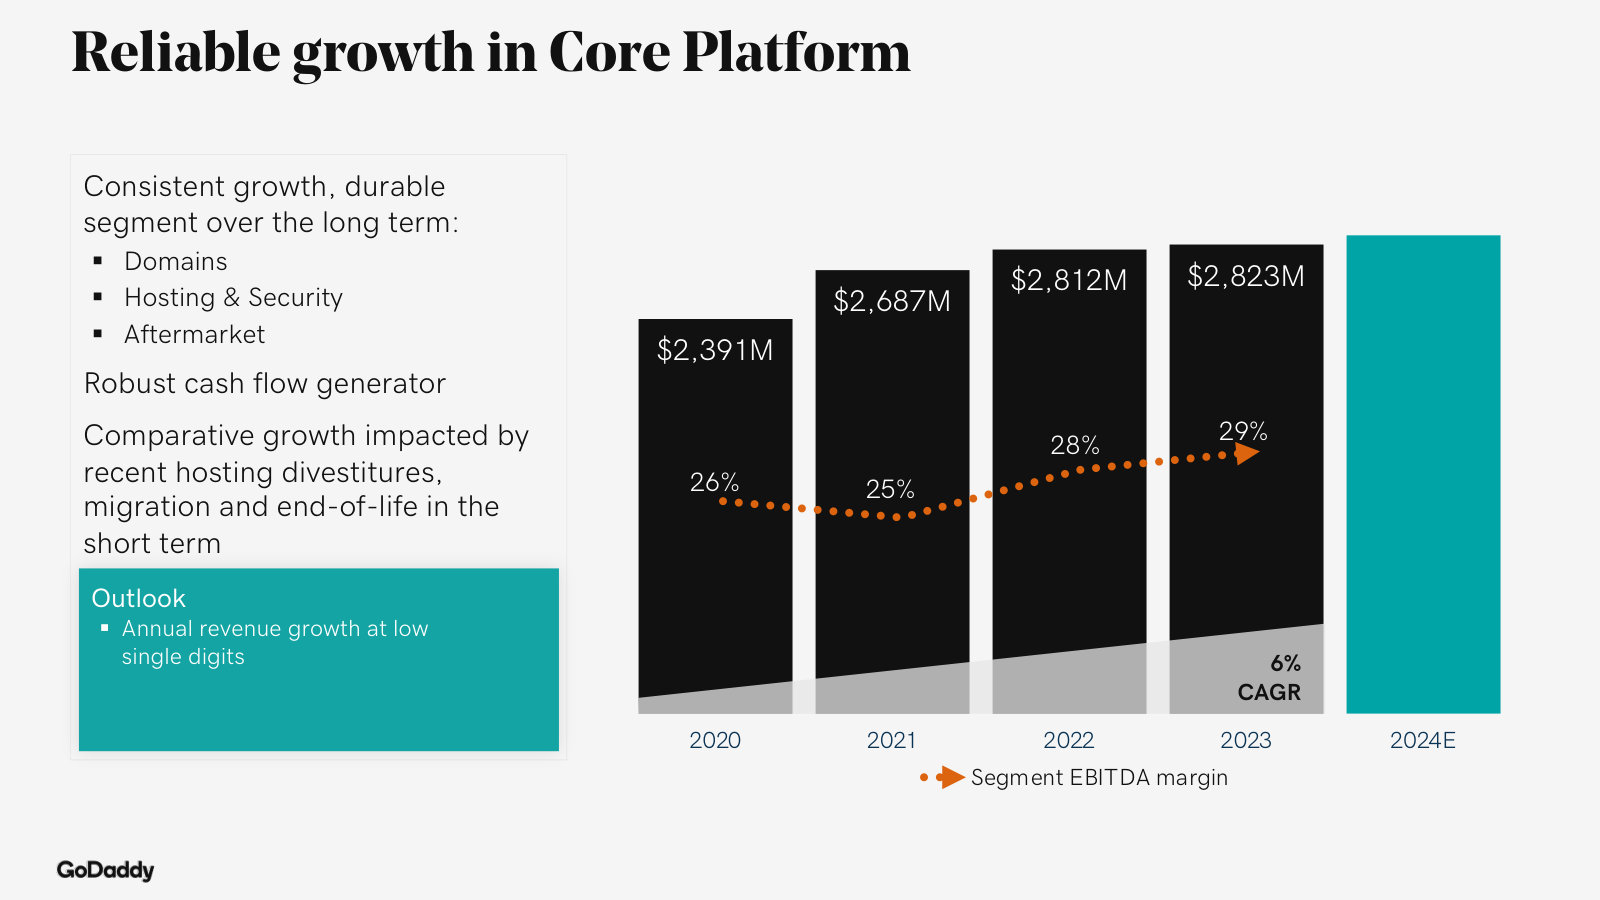
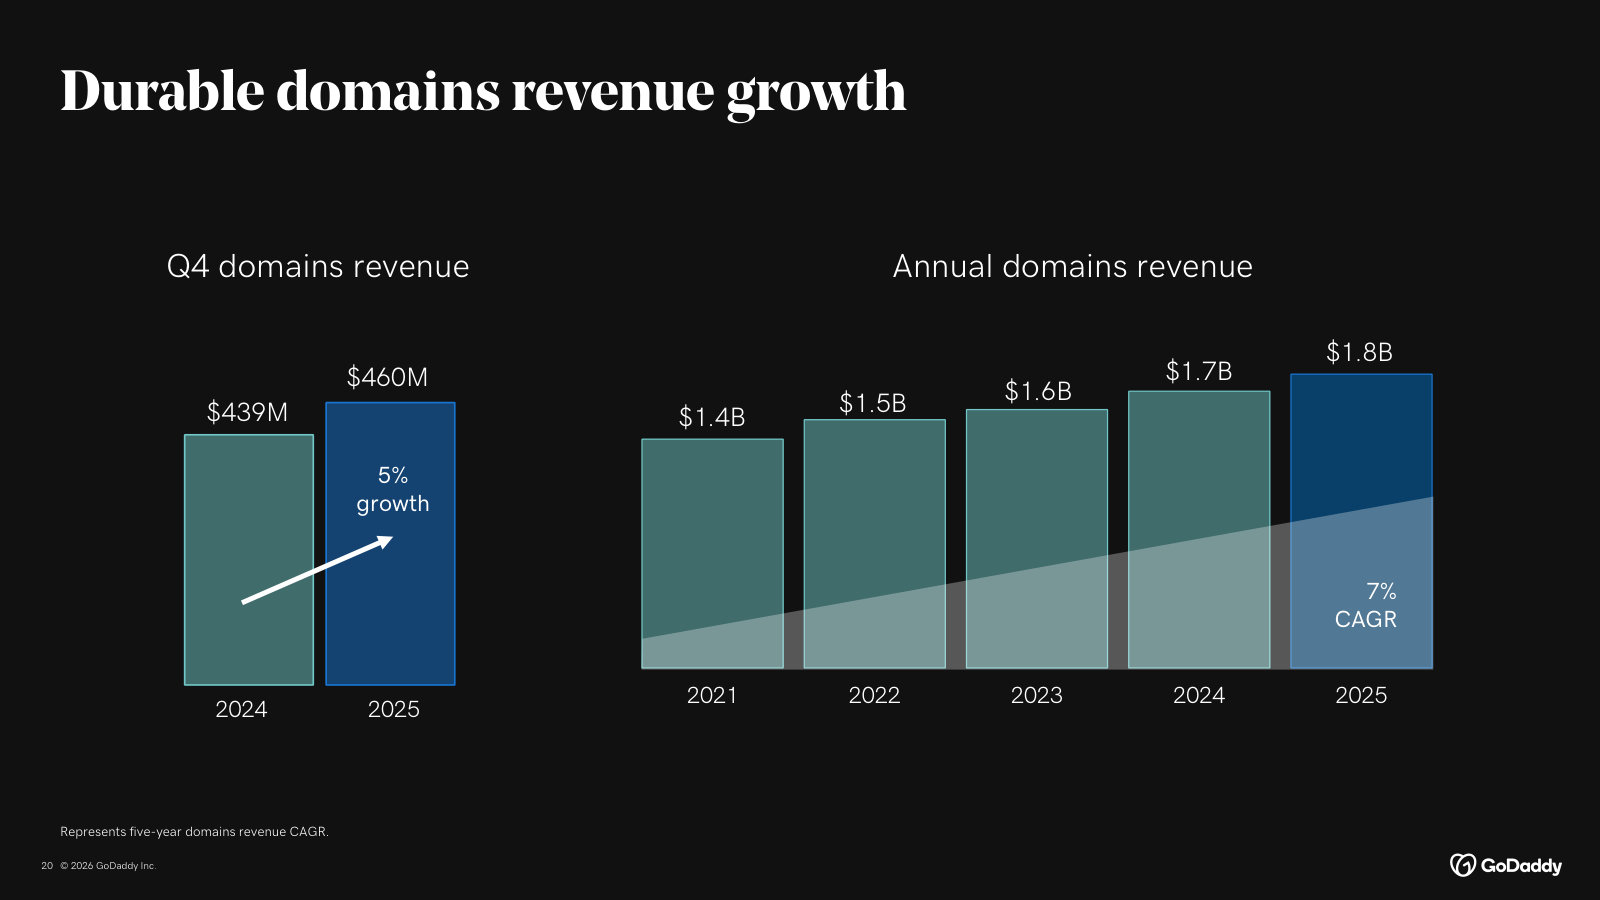
| Core platform: domains | 1,816 | 1,959 | 2,018 | 2,153 | 2,310 |
| Core platform: other | 872 | 852 | 805 | 768 | 752 |
| Total revenue | 3,816 | 4,091 | 4,254 | 4,573 | 4,951 |
| Total revenue growth, derived | — | +7.2% | +4.0% | +7.5% | +8.3% |
Source: Note 2 Disaggregated Revenue; Consolidated Statements of Operations [5] [1] [6] [2]. Click any linked figure to open the filing page with the row highlighted.
Segment EBITDA
| Segment EBITDA | FY2021 | FY2022 | FY2023 | FY2024 | FY2025 |
|---|---|---|---|---|---|
| Applications and Commerce Segment EBITDA | 448 | 523 | 594 | 739 | 857 |
| Core Platform Segment EBITDA | 680 | 784 | 816 | 932 | 1,010 |
| Total Segment EBITDA | 1,127 | 1,306 | 1,411 | 1,671 | 1,867 |
Source: Note 17 Segment Information (Segment EBITDA) [7] [8] [9] [10]. Click any linked figure to open the filing page with the row highlighted.
Income Statement
Source: Consolidated Statements of Operations [1] [2] [3] [4]. Click any linked figure to open the filing page with the row highlighted.
Columns marked E are consensus analyst estimates shown alongside reported results for direct comparison; they are not company guidance.
Estimate source: Yahoo Finance analyst consensus, as of 2026-07-13. Estimate figures link to the consensus source, not to filing pages.
Balance Sheet
Source: Consolidated Balance Sheets [11] [12] [13] [14]. Click any linked figure to open the filing page with the row highlighted.
Cash Flow
Source: Consolidated Statements of Cash Flows [15] [16] [17] [18]. Click any linked figure to open the filing page with the row highlighted.
Revenue by Geography
| Revenue by Geography | FY2021 | FY2022 | FY2023 | FY2024 | FY2025 |
|---|---|---|---|---|---|
| U.S. | 2,545 | 2,757 | 2,873 | 3,113 | 3,324 |
| International | 1,271 | 1,334 | 1,381 | 1,460 | 1,627 |
| Total revenue | 3,816 | 4,091 | 4,254 | 4,573 | 4,951 |
Source: Note 2 Revenue by geography (customer billing address) [19] [1] [6] [2]. Click any linked figure to open the filing page with the row highlighted.
Bookings, Recurring Revenue Profitability
| Bookings, Recurring Revenue Profitability | FY2021 | FY2022 | FY2023 | FY2024 | FY2025 |
|---|---|---|---|---|---|
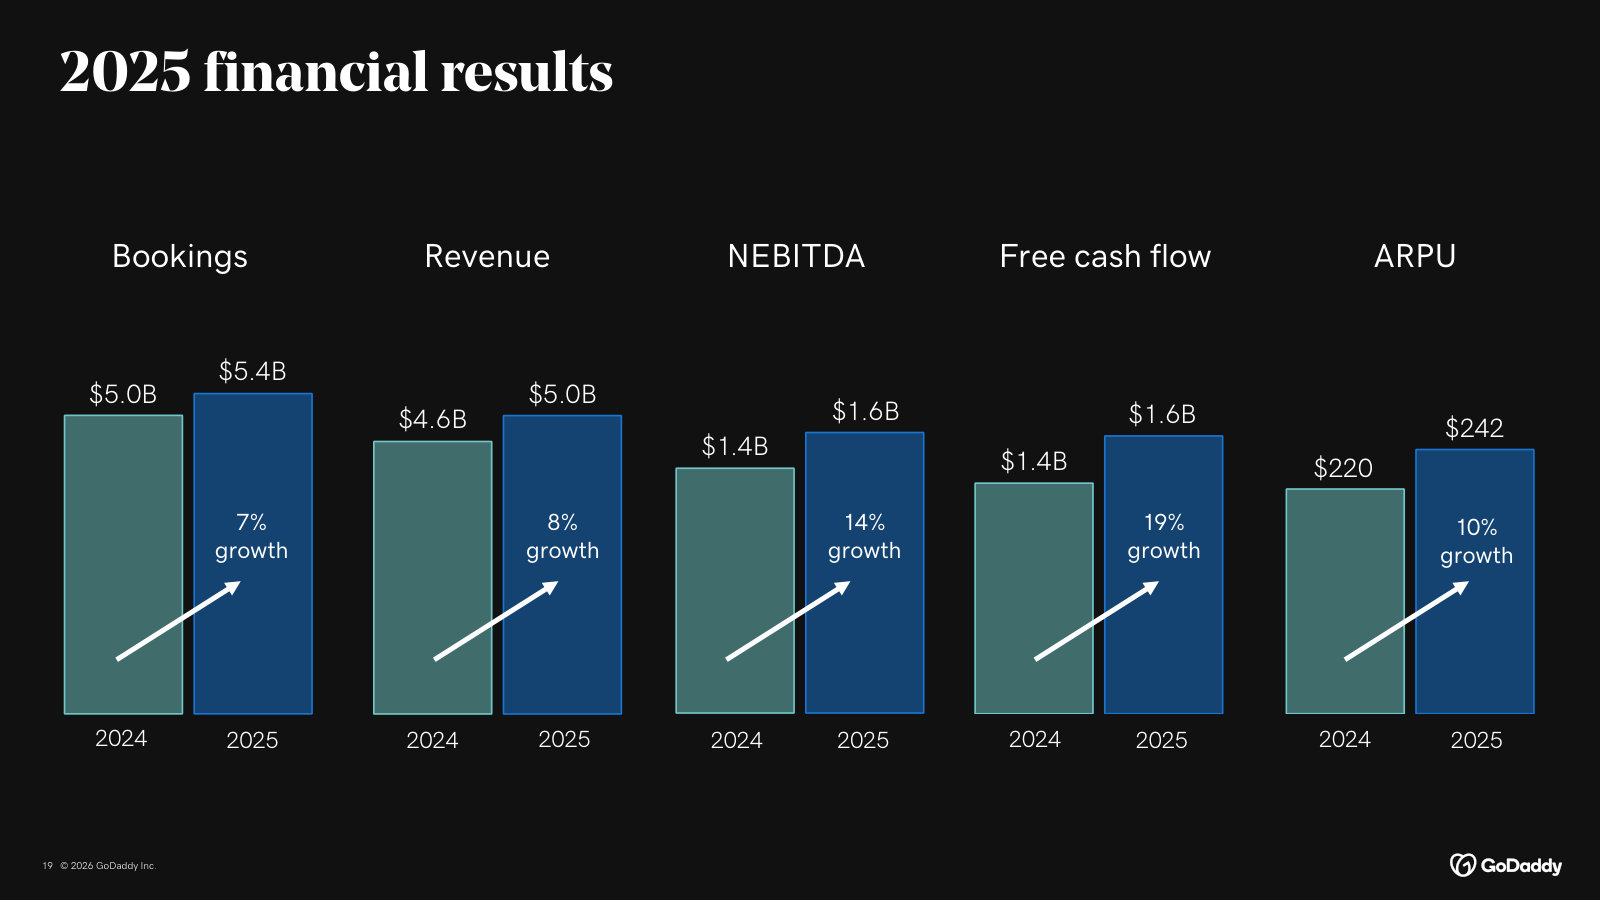
| Total bookings | 4,232 | 4,414 | 4,603 | 5,039 | 5,400 |
| Annualized recurring revenue (ARR) | 3,434 | 3,570 | 3,729 | 4,043 | 4,336 |
| Normalized EBITDA | 872 | 1,013 | 1,134 | 1,396 | 1,586 |
Source: company filings [20] [21] [22]. Click any linked figure to open the filing page with the row highlighted.
Customer Base Domains
| Customer Base Domains | FY2021 | FY2022 | FY2023 | FY2024 | FY2025 |
|---|---|---|---|---|---|
| Total customers at period end (thousands) | 20,701 | 20,897 | 21,026 | 20,511 | 20,422 |
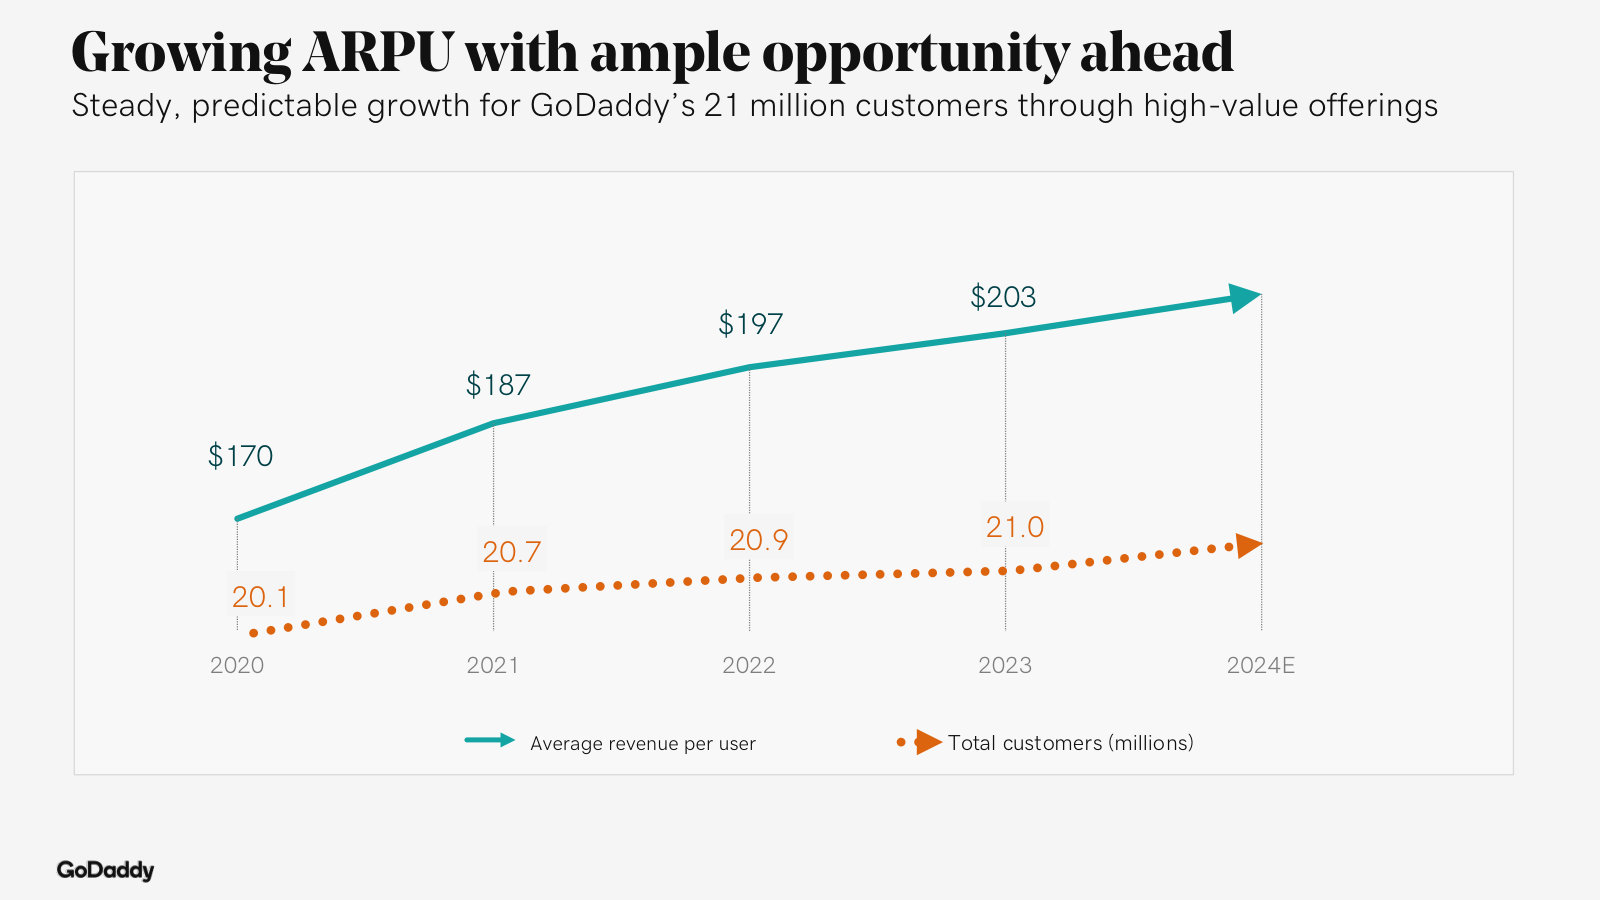
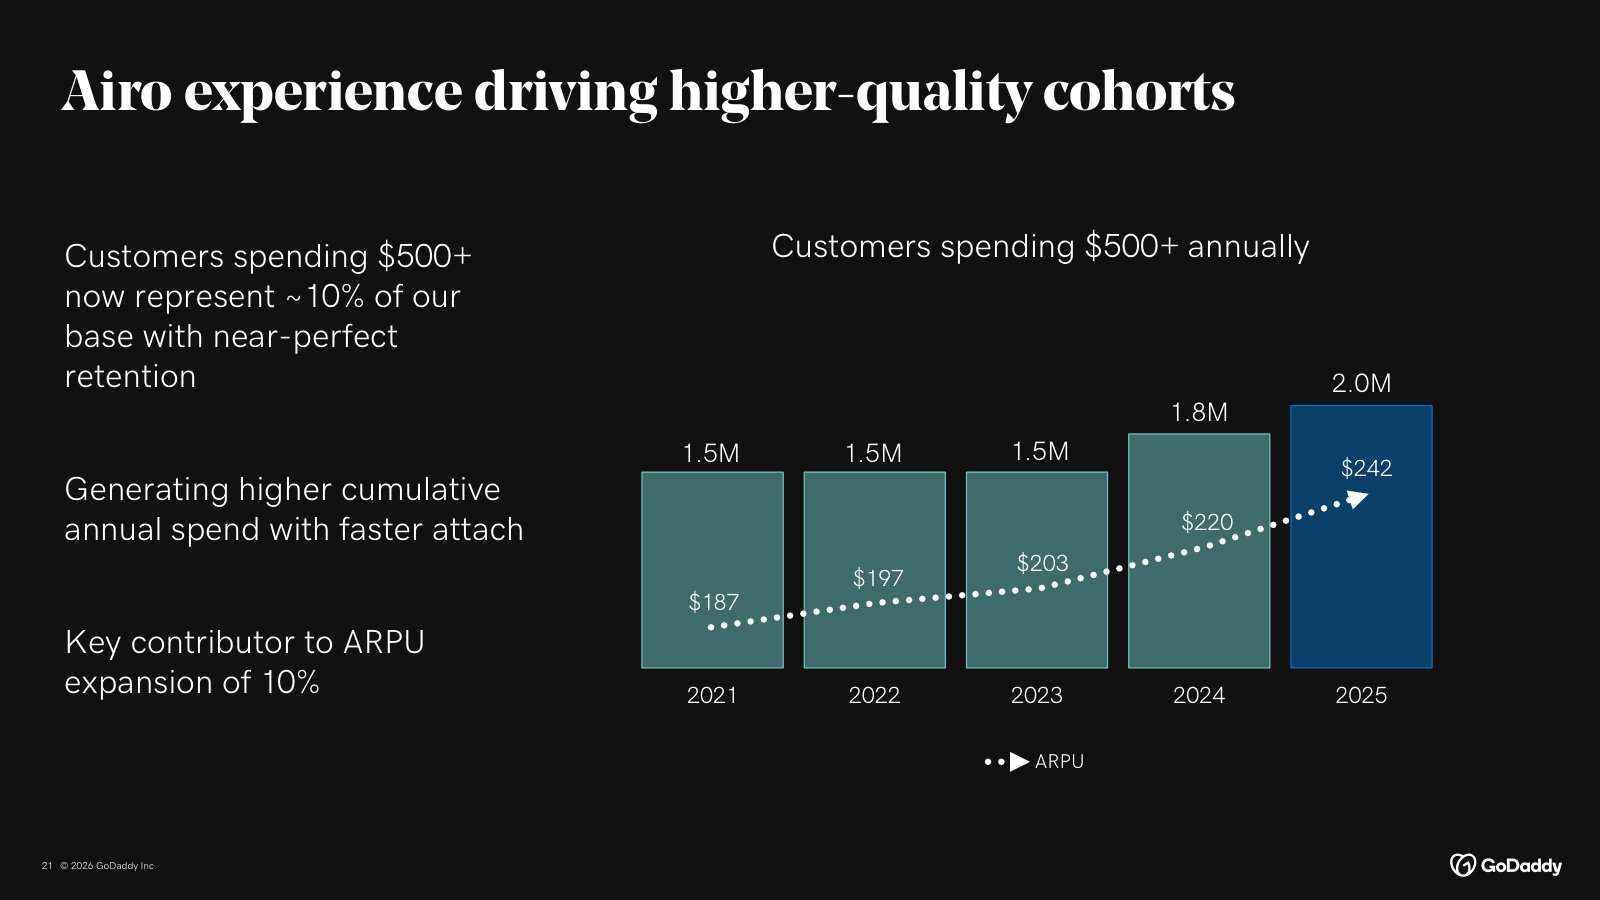
| Average revenue per user (ARPU) | 187.00 | 197.00 | 203.00 | 220.00 | 242.00 |
| Domains under management (thousands) | — | 83,857 | 83,554 | 81,013 | 80,793 |
| Customer retention rate | 85.0% | 85.0% | 85.0% | 84.0% | 85.0% |
Source: company filings [20] [23] [24] [21]. Click any linked figure to open the filing page with the row highlighted.
Long-Term Record
| Fiscal year | Total revenue | Operating income | Net income attributable to GoDaddy Inc. | Diluted earnings per share | Net cash provided by operating activities |
|---|---|---|---|---|---|
| FY2016 | 1,848 | 50 | (16) | — | 386 |
| FY2017 | 2,232 | 67 | 136 | — | 476 |
| FY2018 | 2,660 | 150 | 77 | — | 560 |
| FY2019 | 2,988 | 203 | 137 | 0.76 | 723 |
| FY2020 | 3,317 | 272 | (495) | (2.94) | 765 |
| FY2021 | 3,816 | 382 | 242 | 1.42 | 829 |
| FY2022 | 4,091 | 499 | 352 | 2.19 | 980 |
| FY2023 | 4,254 | 547 | 1,375 | 9.08 | 1,048 |
| FY2024 | 4,573 | 894 | 937 | 6.45 | 1,288 |
| FY2025 | 4,951 | 1,127 | 875 | 6.22 | 1,599 |
Source: consolidated statements across filings; older years from the standardized feed [15] [1] [16] [2]. Click any linked figure to open the filing page with the row highlighted.
Operating KPIs
| KPI | FY2021 | FY2022 | FY2023 | FY2024 | FY2025 |
|---|---|---|---|---|---|
| Total bookings | 4,232 | 4,414 | 4,603 | 5,039 | 5,400 |
| Annualized recurring revenue | 3,434 | 3,570 | 3,729 | 4,043 | 4,336 |
| Total customers at period end | 20,704,000 | 20,897,000 | 21,026,000 | 20,511,000 | 20,422,000 |
| Average revenue per user (US$) | 187 | 197 | 203 | 220 | 242 |
Source: company-reported operating metrics [20] [21] [22]. Click any linked figure to open the filing page with the row highlighted.
Analyst Consensus
Current price
Mean target
Median target
High target
Low target
Estimate source: Yahoo Finance analyst consensus, as of 2026-07-13. Estimate figures link to the consensus source, not to filing pages.
Traceability
339 of 426 figures on this page (80%) link to the filing page where they are printed — click a linked figure to open the source PDF at that page with the row highlighted. Unlinked figures come from standardized data feeds or pre-filing years.
Display units are US$ millions, per the filings' units line 'In millions, except shares in thousands and per share amounts'. Diluted share counts are shown in millions (filings print them in thousands).
Each fiscal year is cited to that year's own Form 10-K primary column, except: (a) the FY2021 Applications and commerce / Core platform revenue split, which GoDaddy first reported under the current two-segment structure in the FY2022 10-K (the FY2021 10-K still used the legacy Domains / Hosting and presence / Business applications product lines), so FY2021's revenue-component citations point to the FY2022 10-K; and (b) FY2024 KPI figures, cited to the FY2025 10-K comparative column.
Balance-sheet equity is the filings' bottom-line 'Total stockholders' equity (deficit)' (including non-controlling interests where present: FY2021 83.2 vs 81.7 attributable, FY2022 (329.3) vs (331.8), FY2023 62.2). FY2024-FY2025 had no non-controlling interests. The standardized data feed reports equity attributable to GoDaddy Inc.; the small differences are non-controlling interests, not restatements.
Net income on the income statement is 'Net income attributable to GoDaddy Inc.'; net income on the cash-flow statement is total net income before non-controlling interests (e.g. FY2023 1,375.6 vs 1,374.8 attributable).
Total customers at period end for FY2021 is 20,704 thousand as reported in the FY2022 10-K; the FY2023 10-K shows a marginally restated 20,701 thousand for the same date. The difference is immaterial.
Quarterly cash-flow and balance-sheet statements are omitted: GoDaddy's 10-Qs print cash flows only on a year-to-date basis and the block here focuses on the single-quarter income statement, which the 10-Qs and the Q4 earnings 8-K print directly.
FY2016-FY2018 long-term figures are from the standardized data feed (SEC XBRL) and are shown without page links; FY2016-FY2018 diluted EPS is not available in the feed.
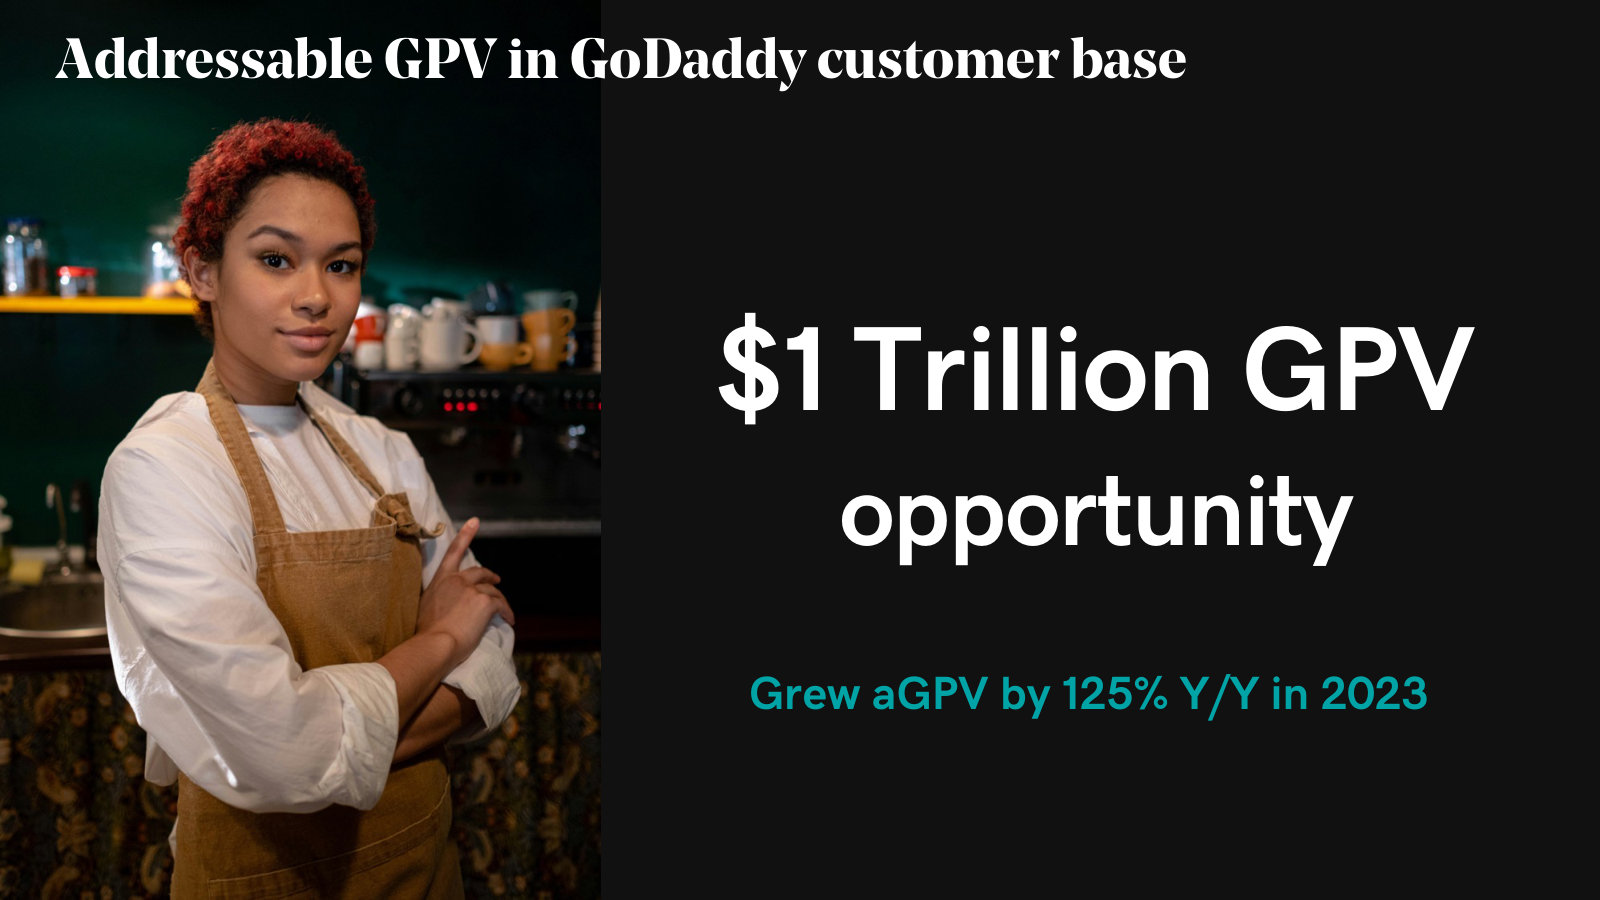
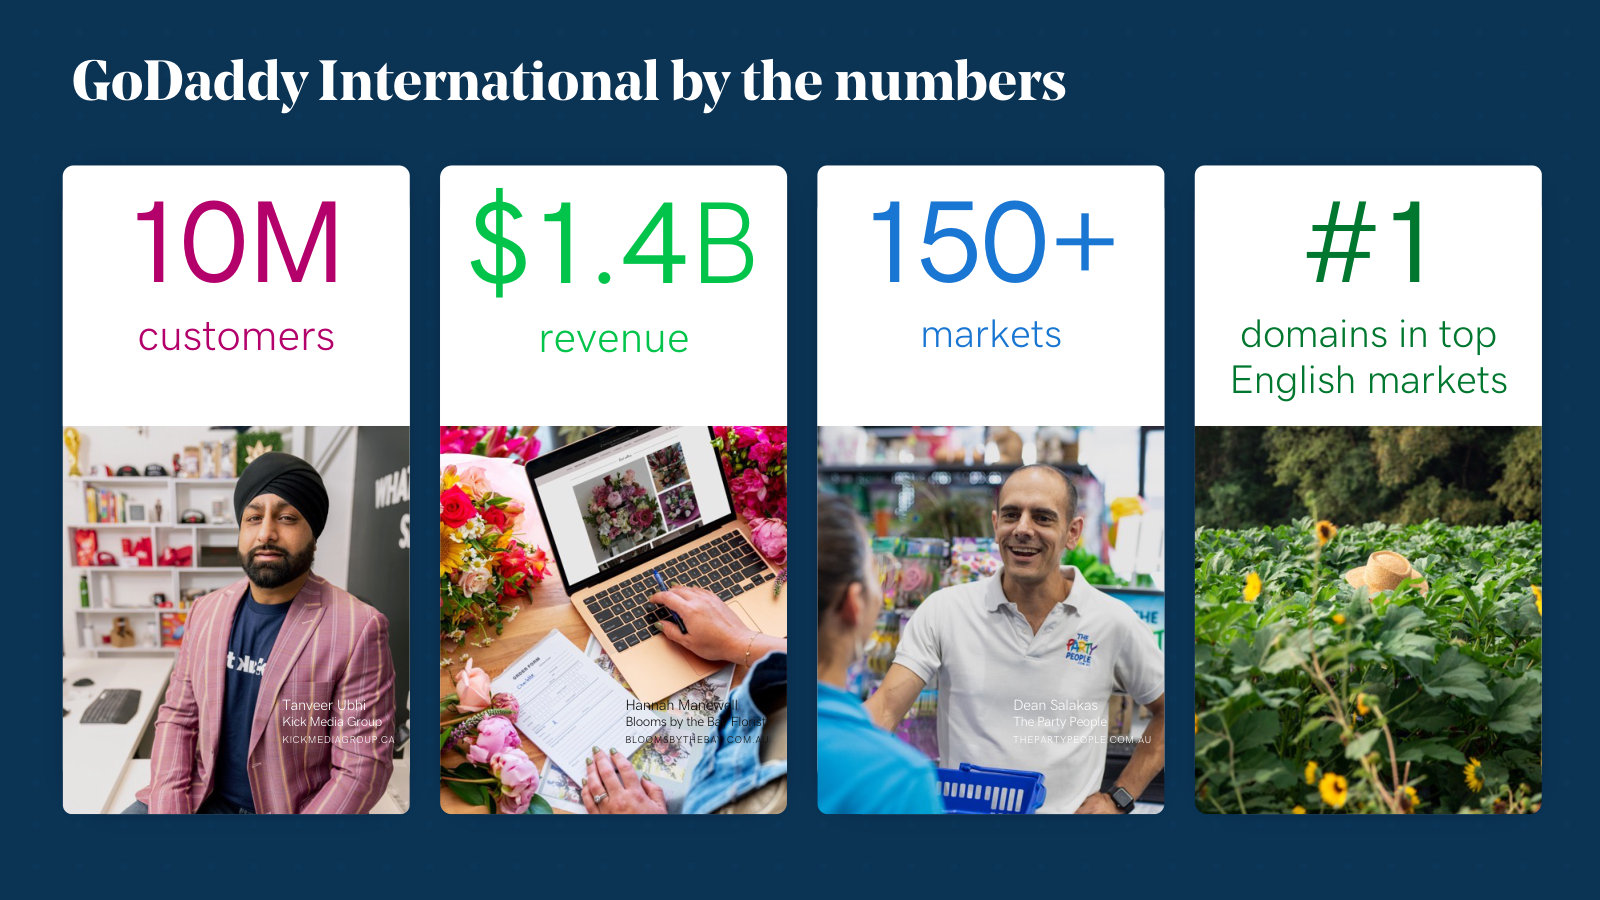
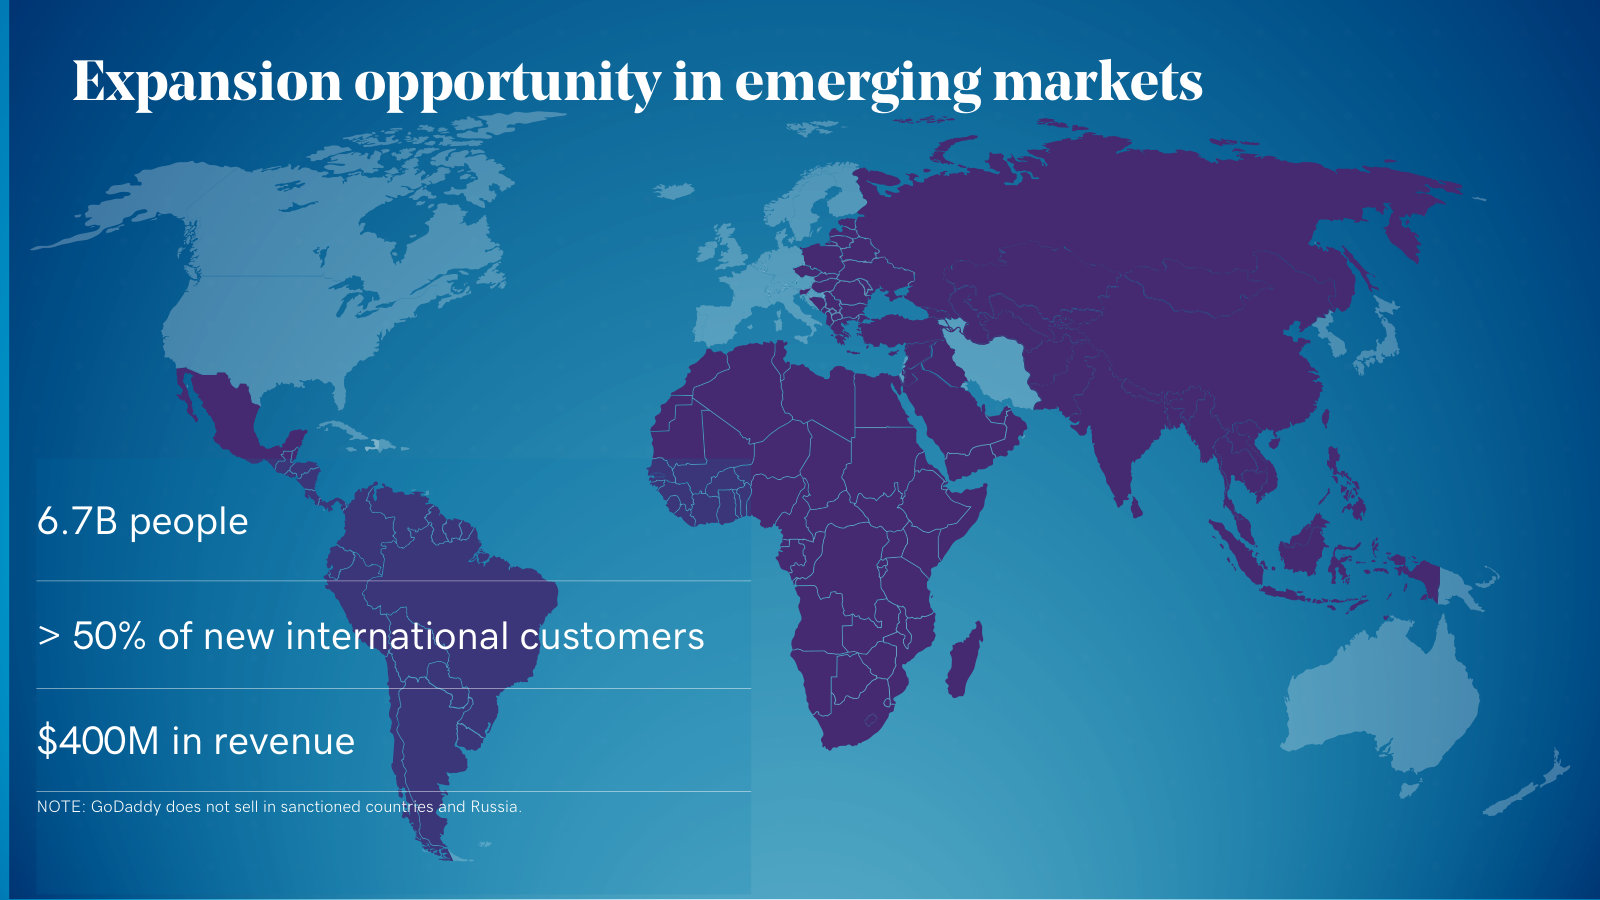
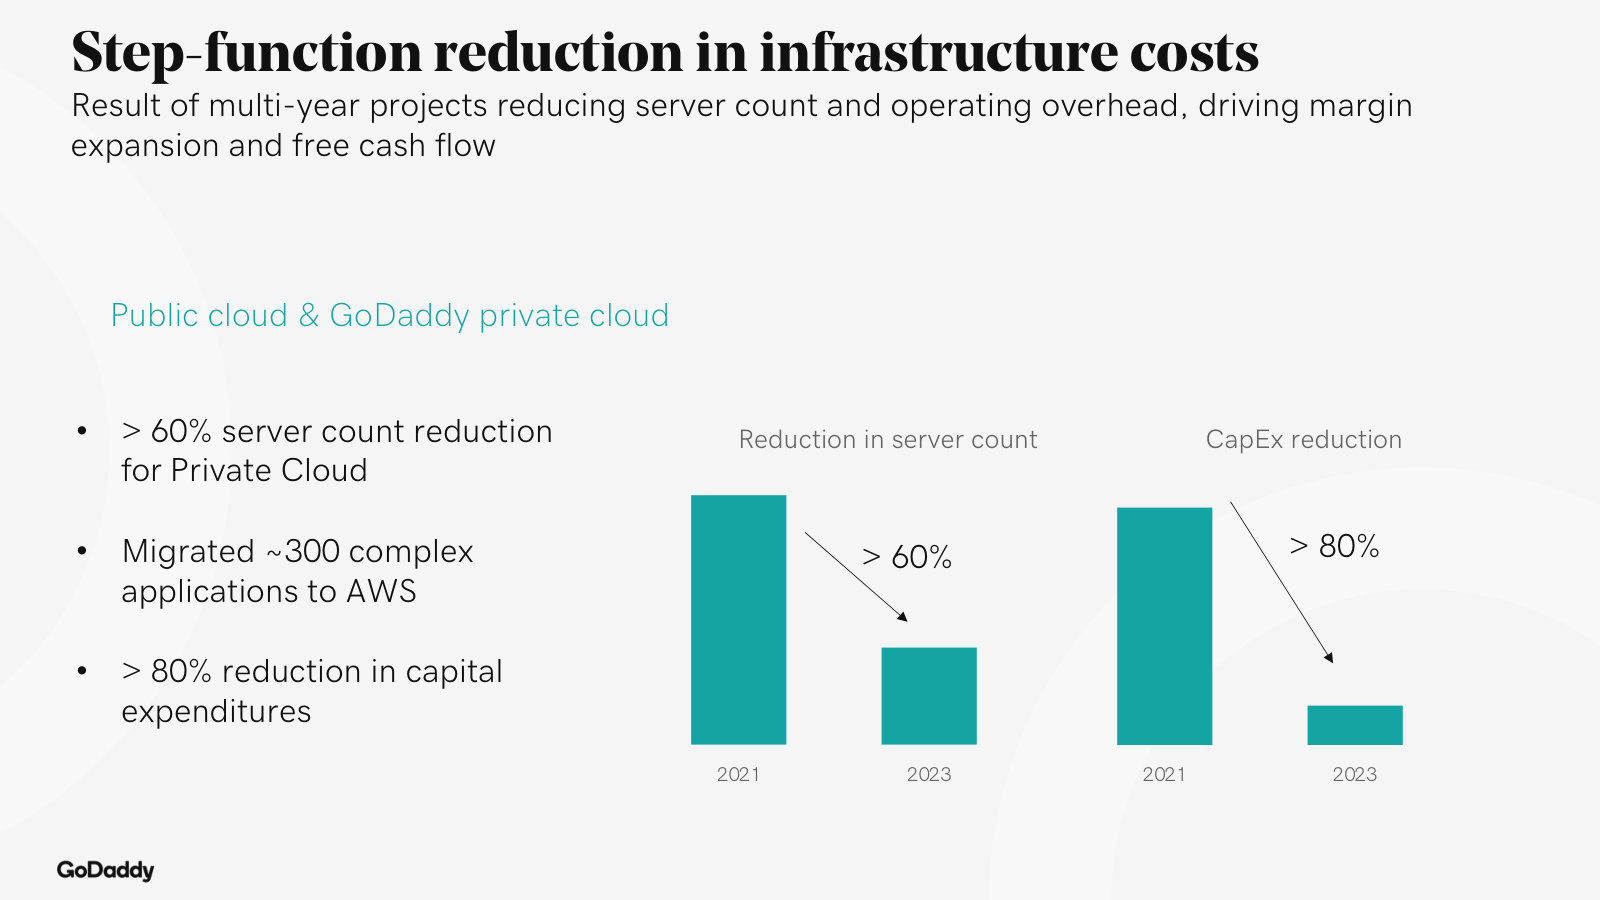
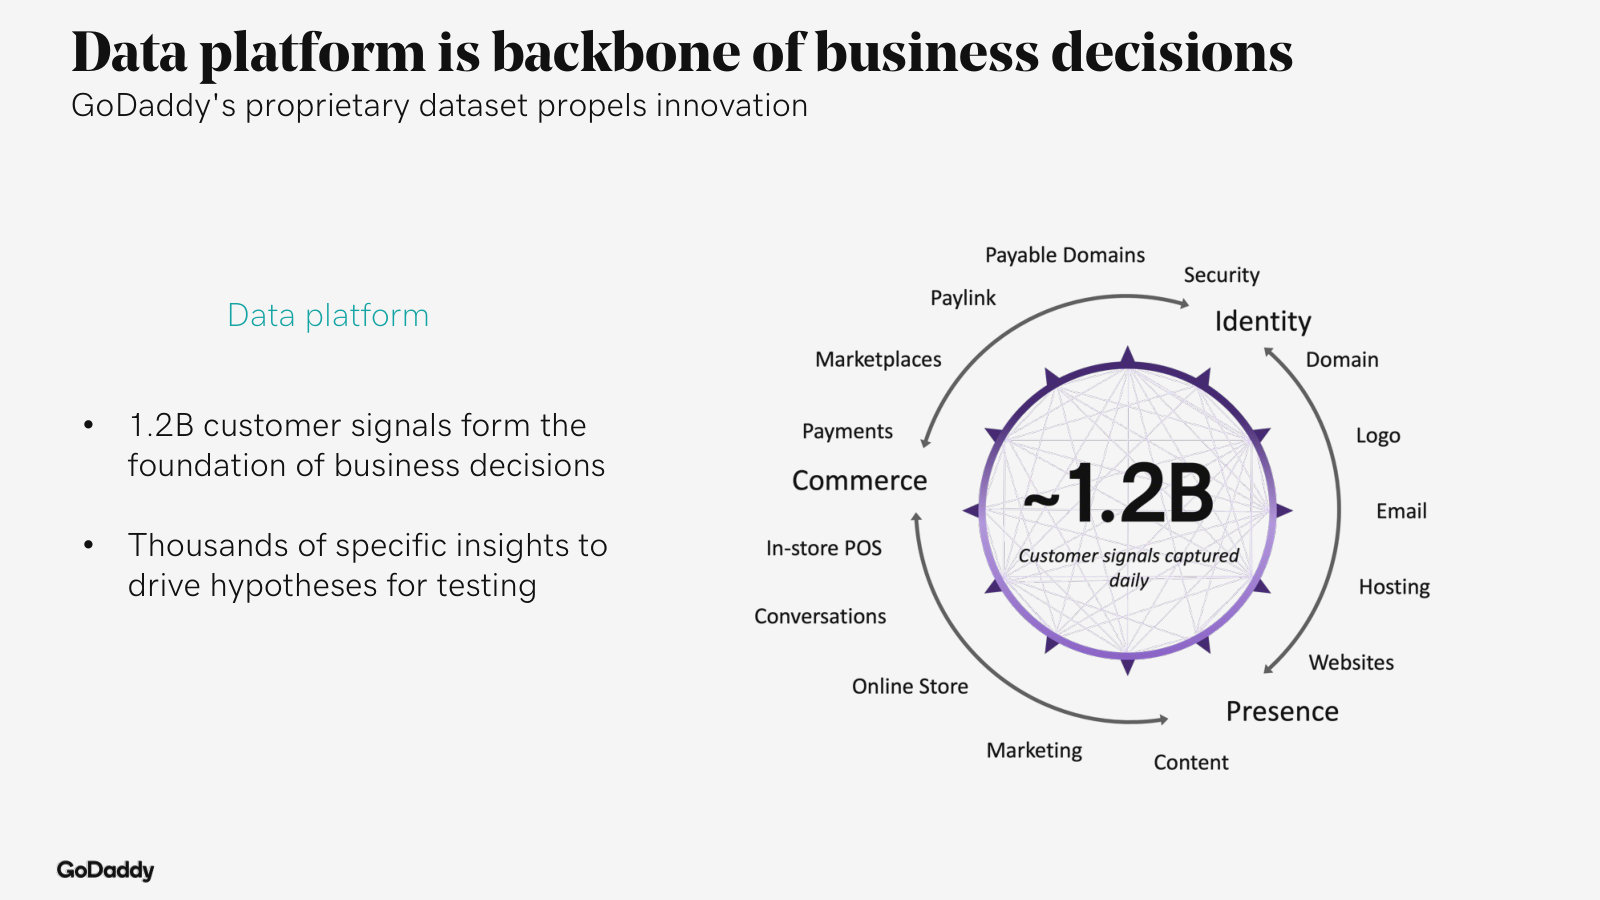
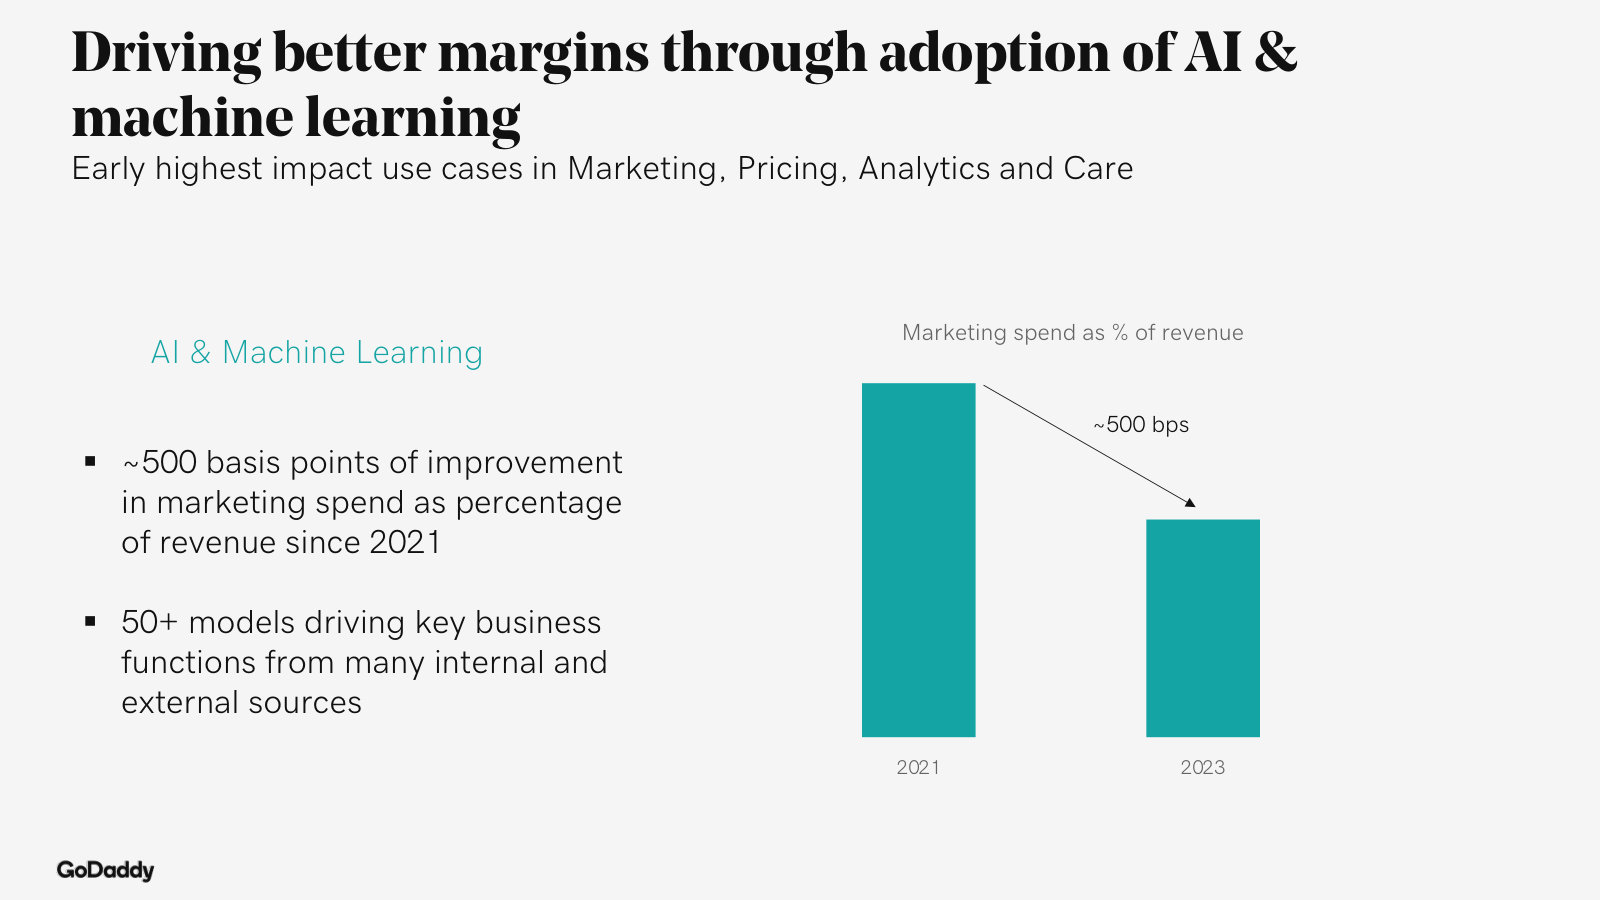
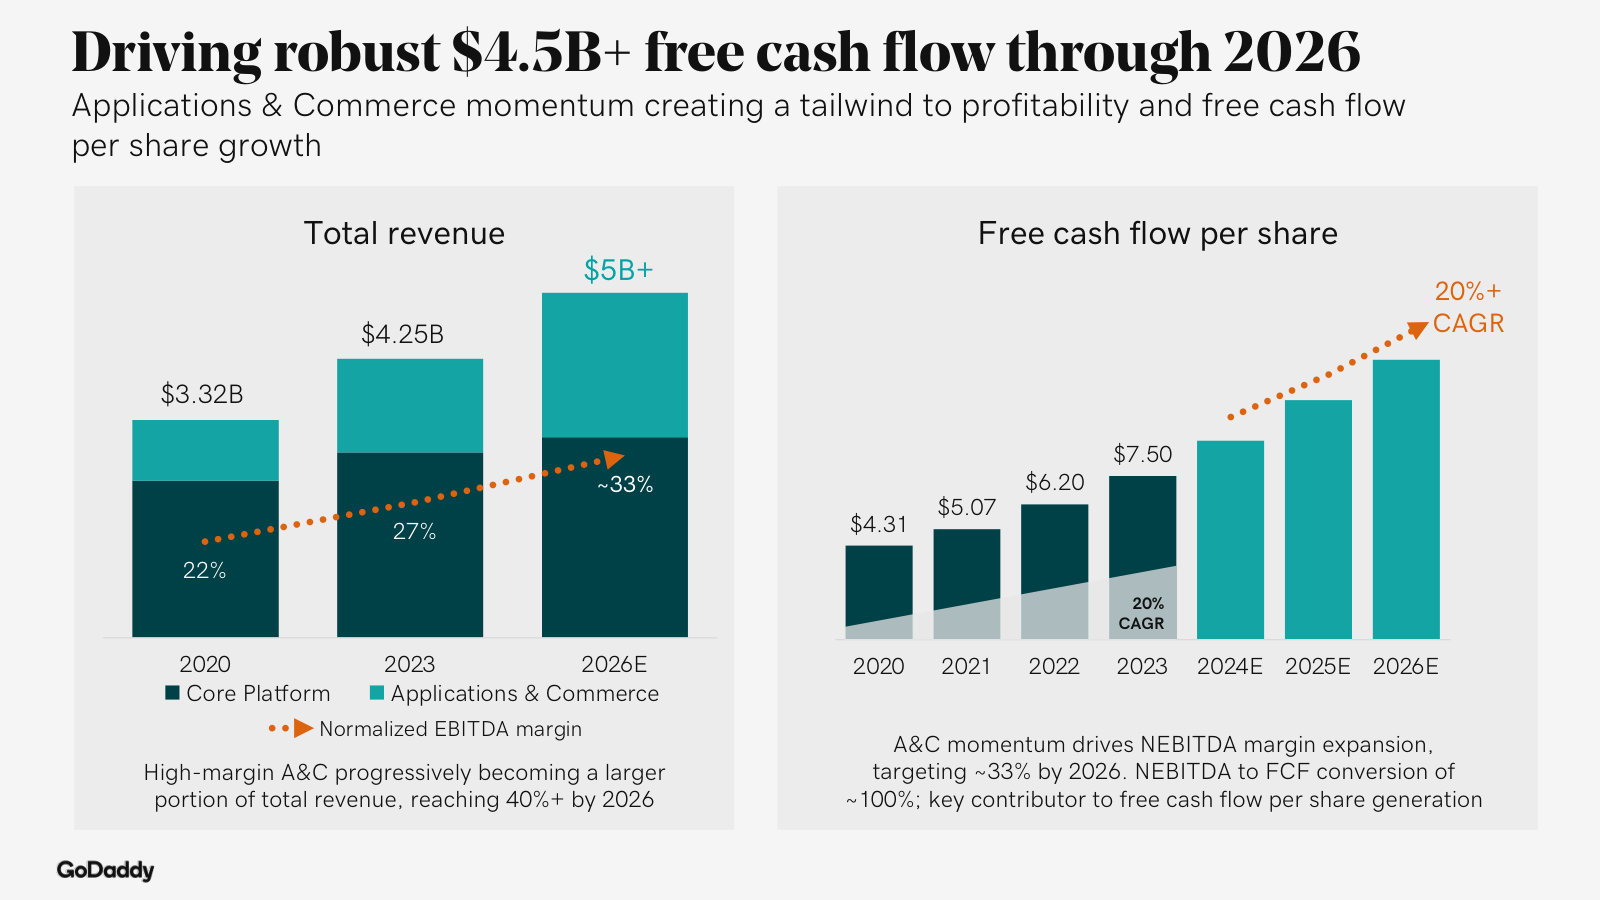
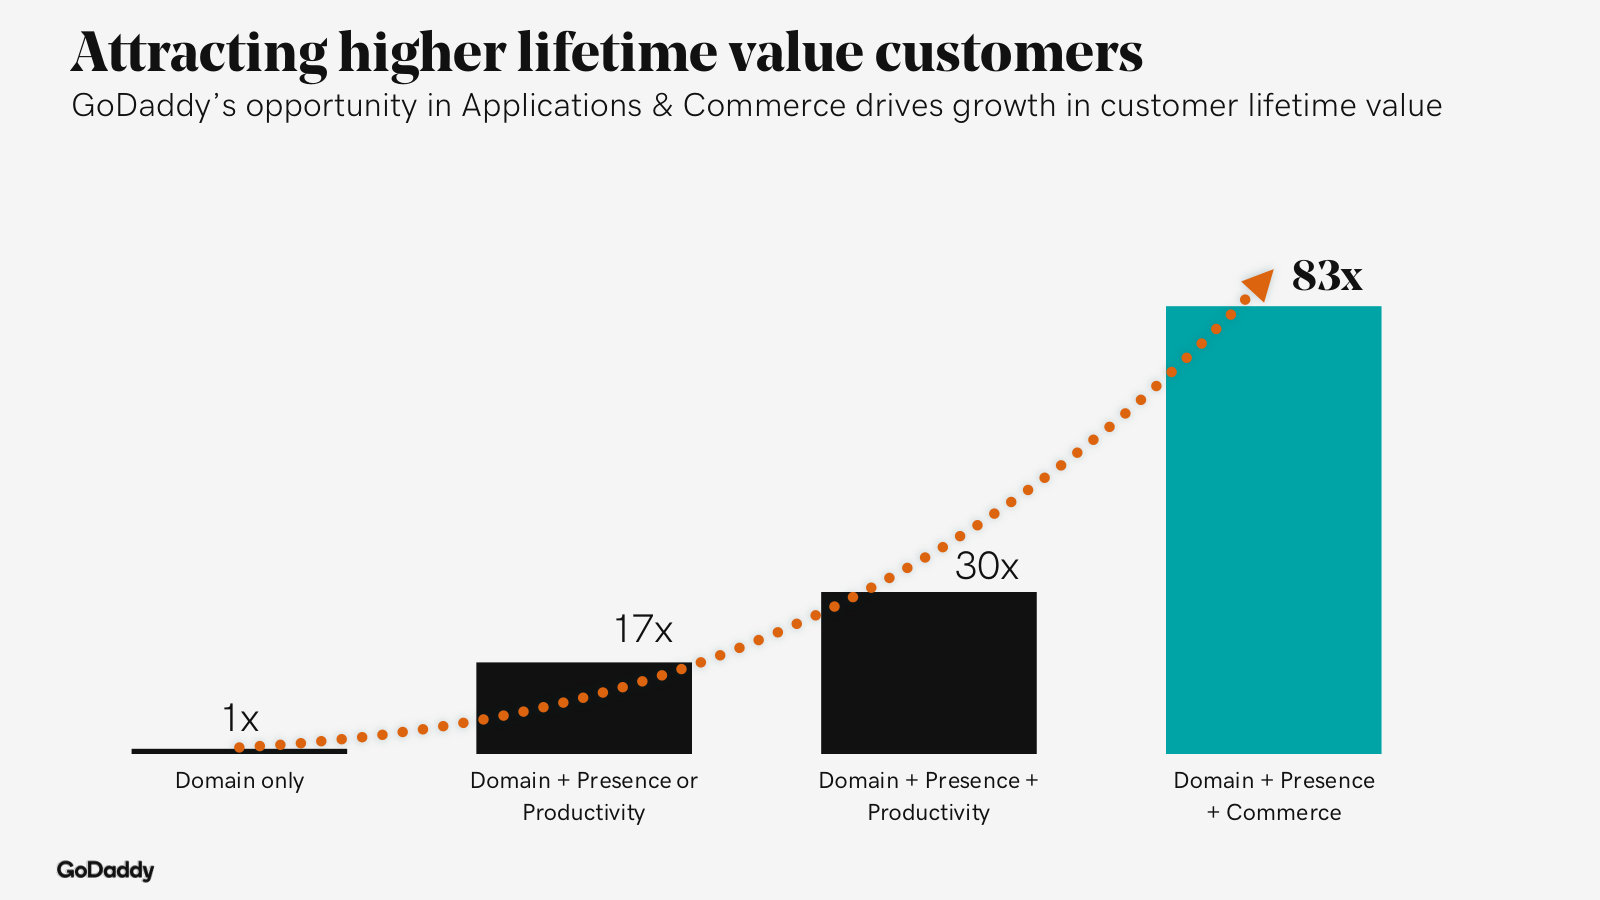
GoDaddy Inc.'s management explains the business in its own materials. The slides below do the most of that work, pulled from the documents preserved in Sources. Each source link opens the complete presentation at that slide in a new tab.
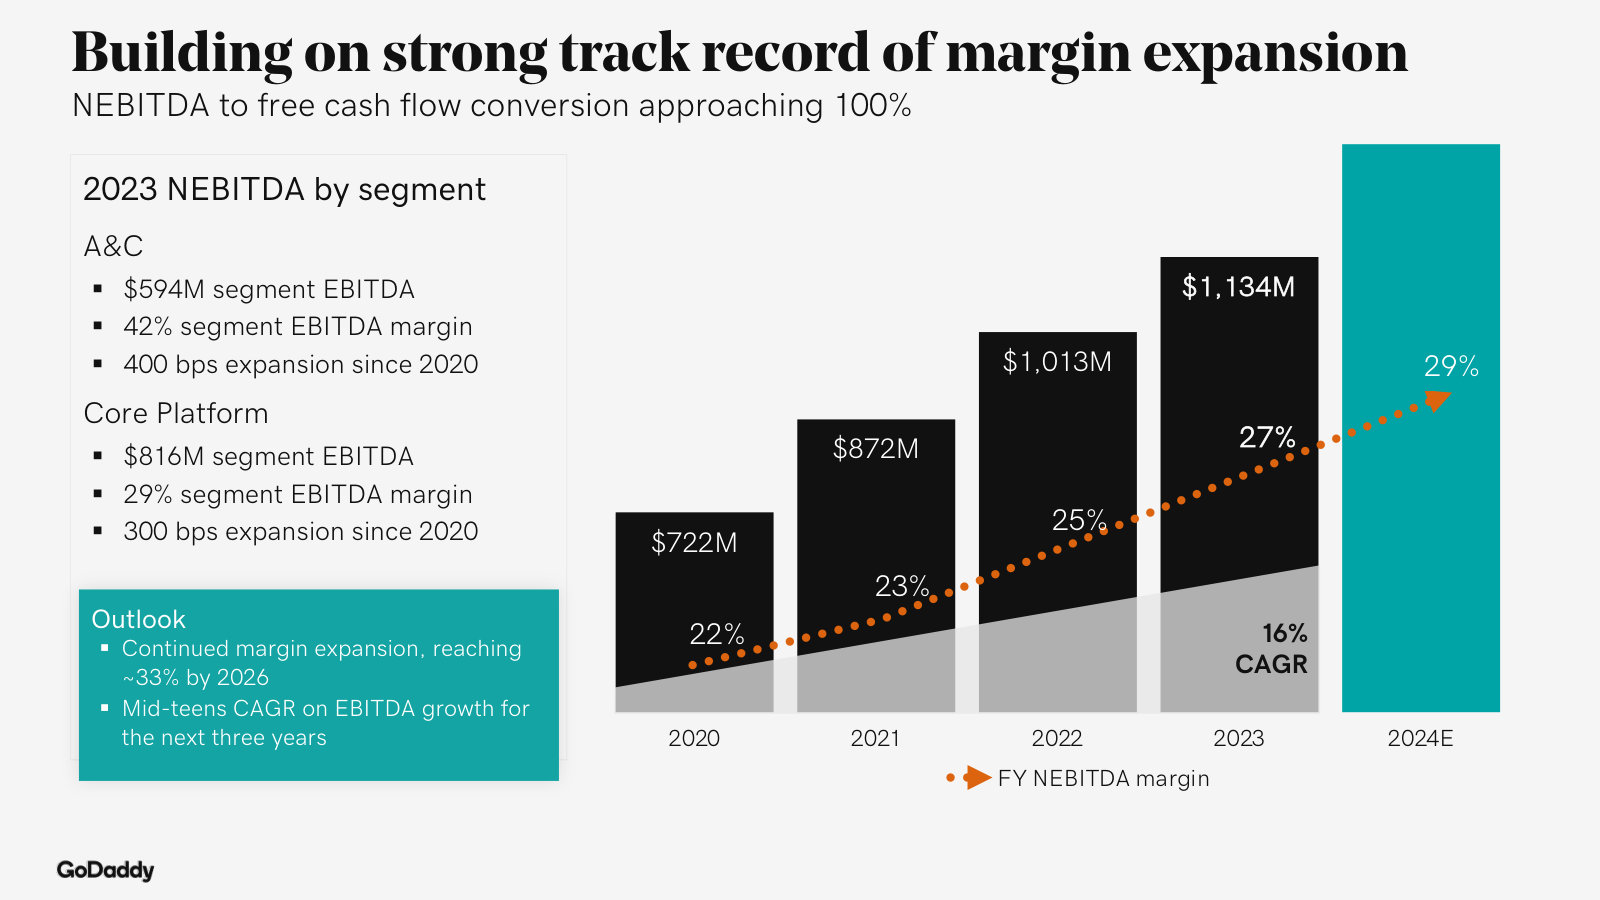
2024 Investor Day — 2024
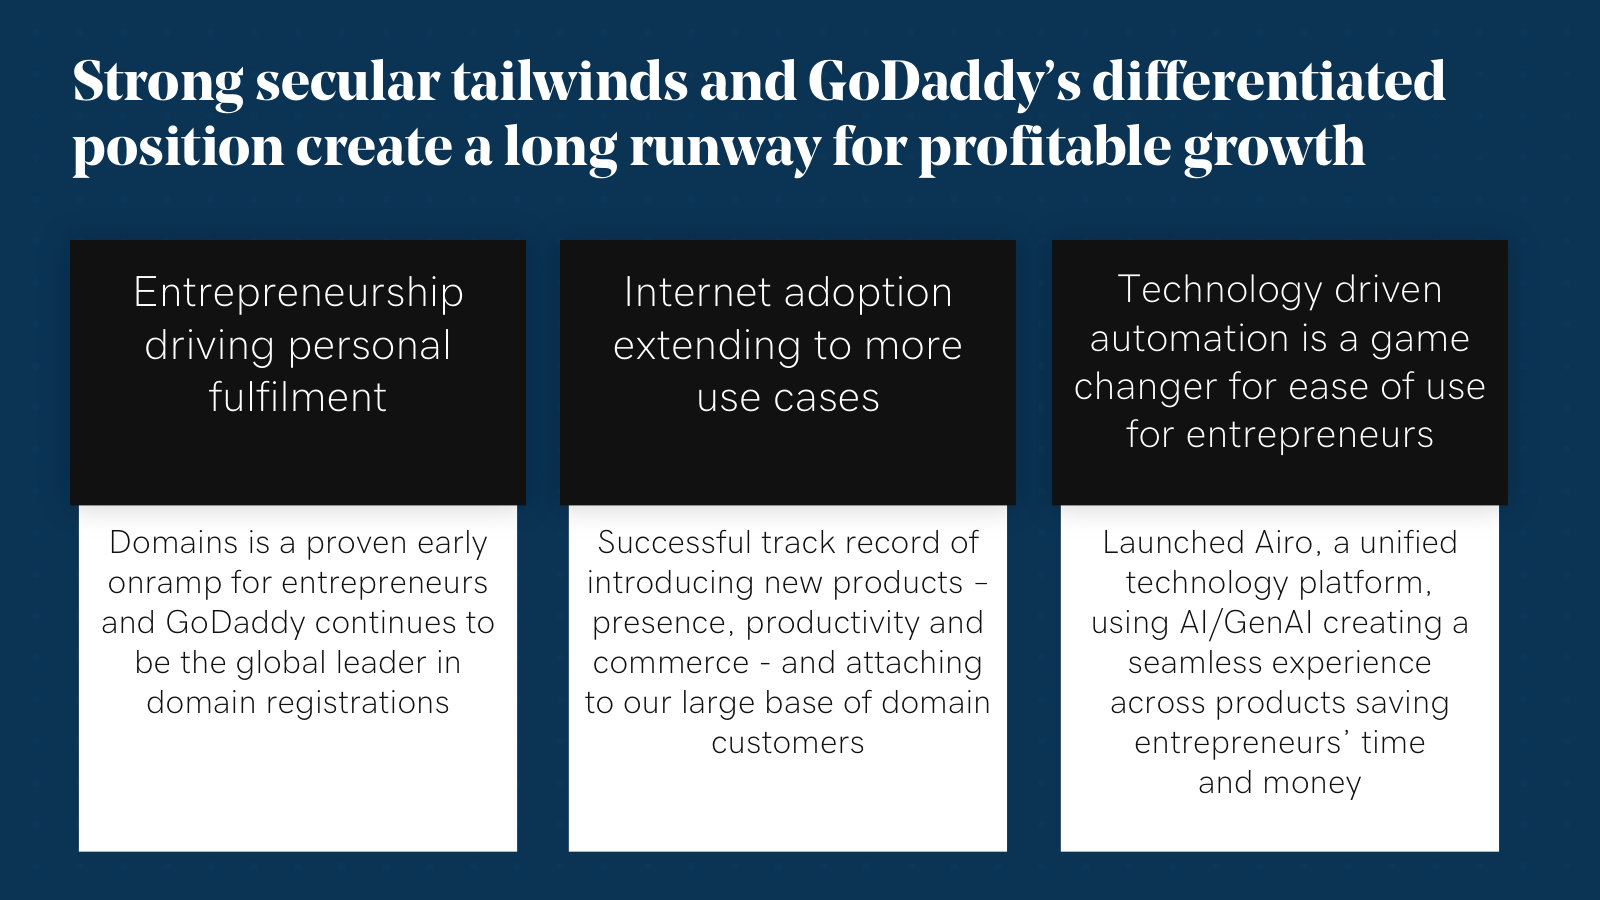
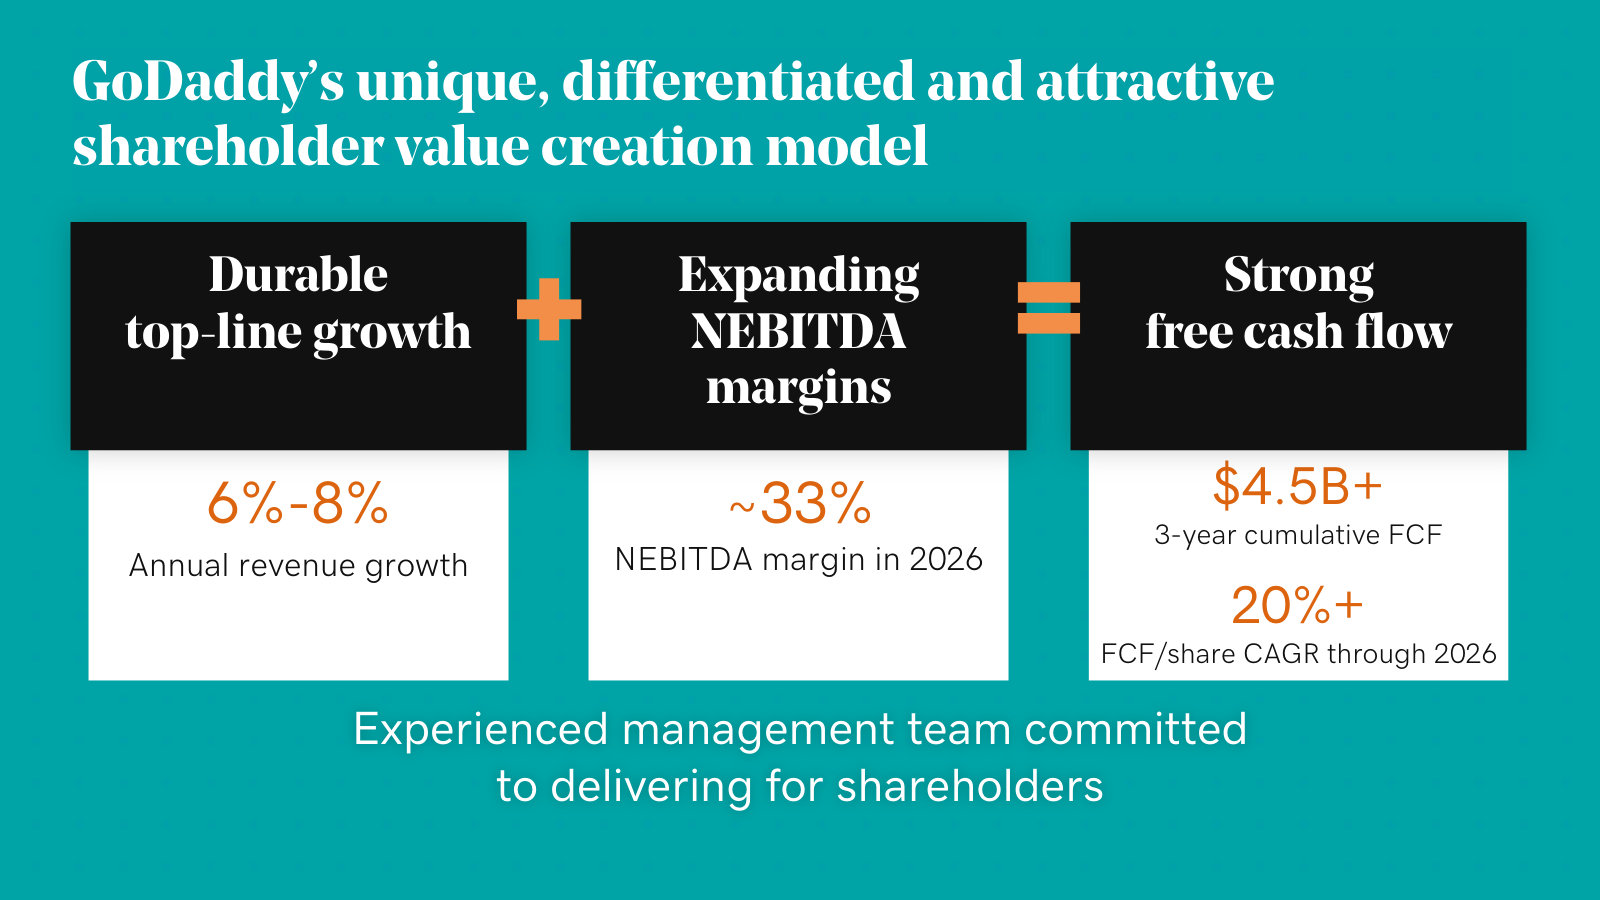
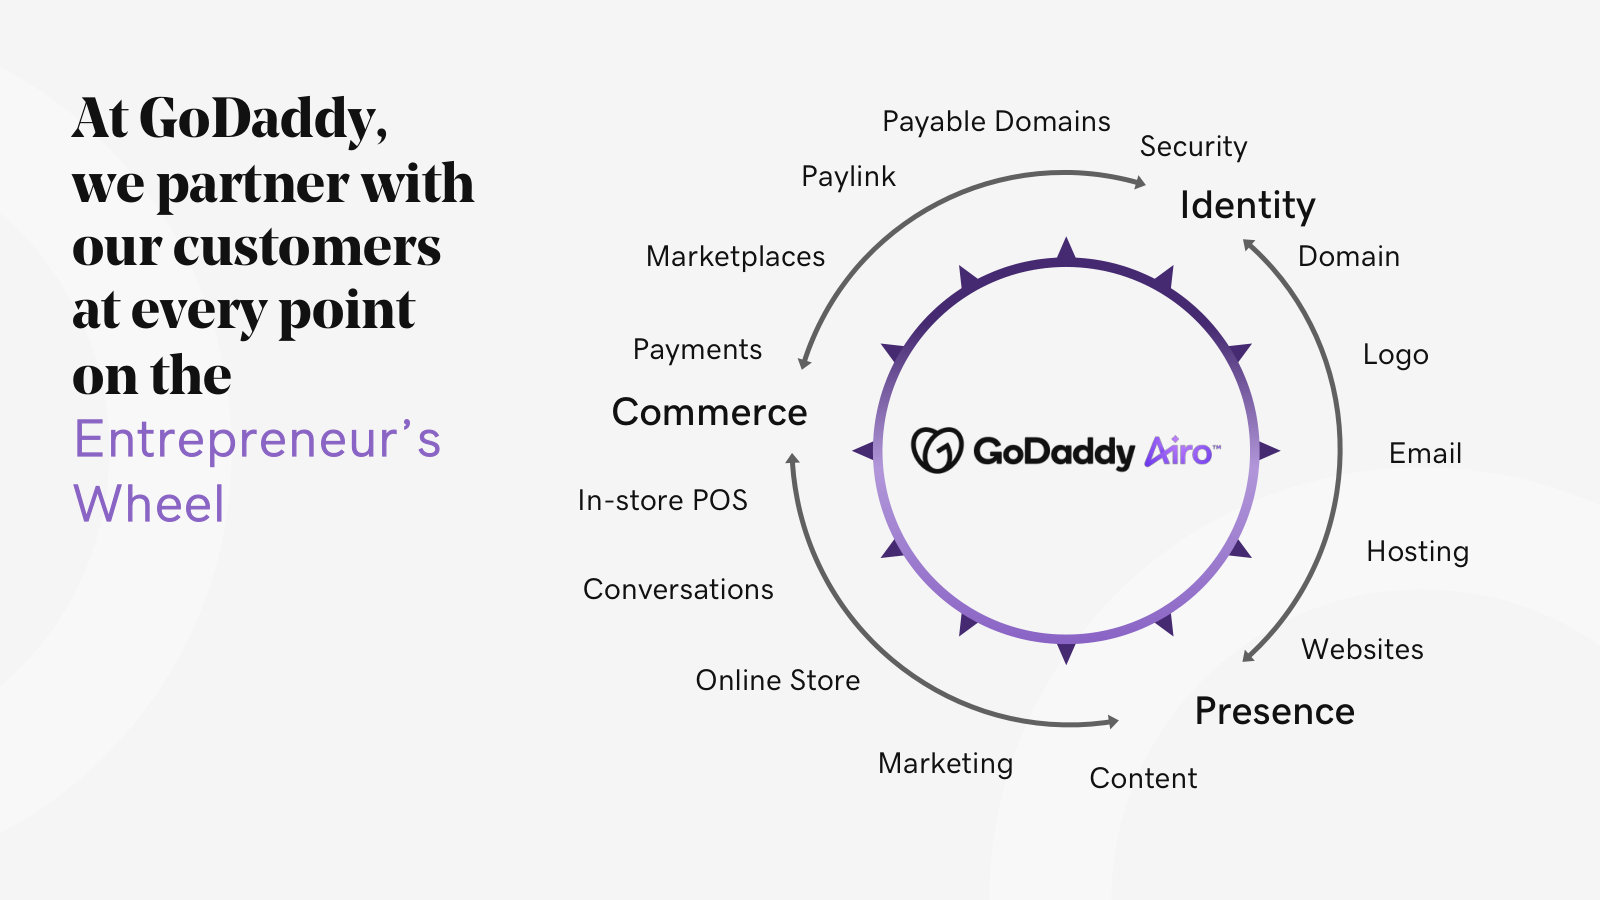
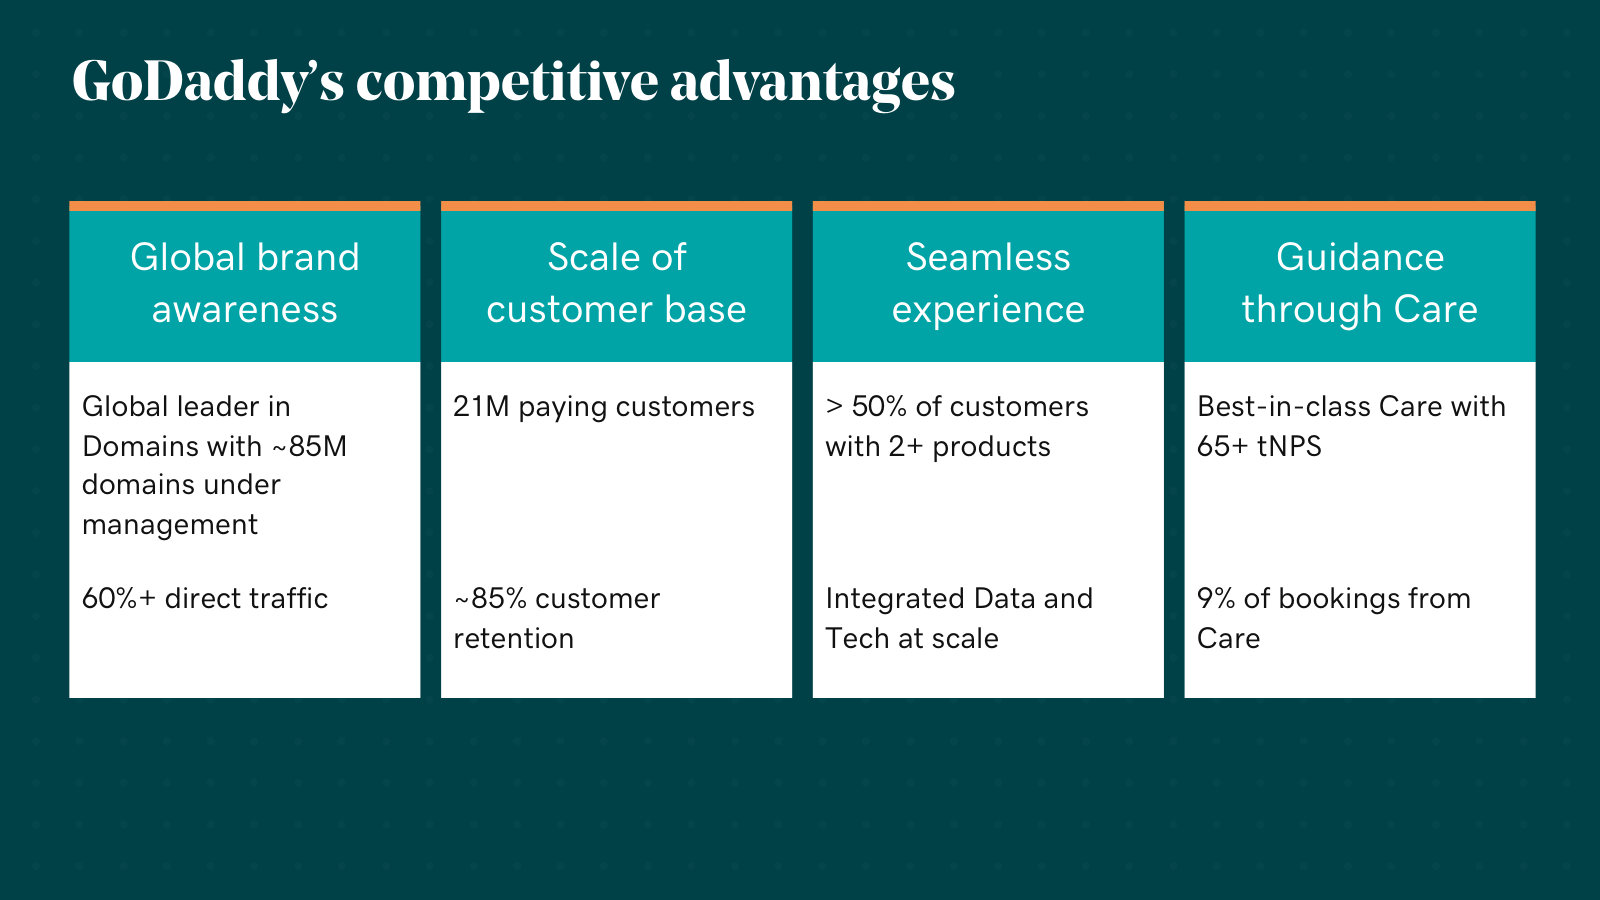
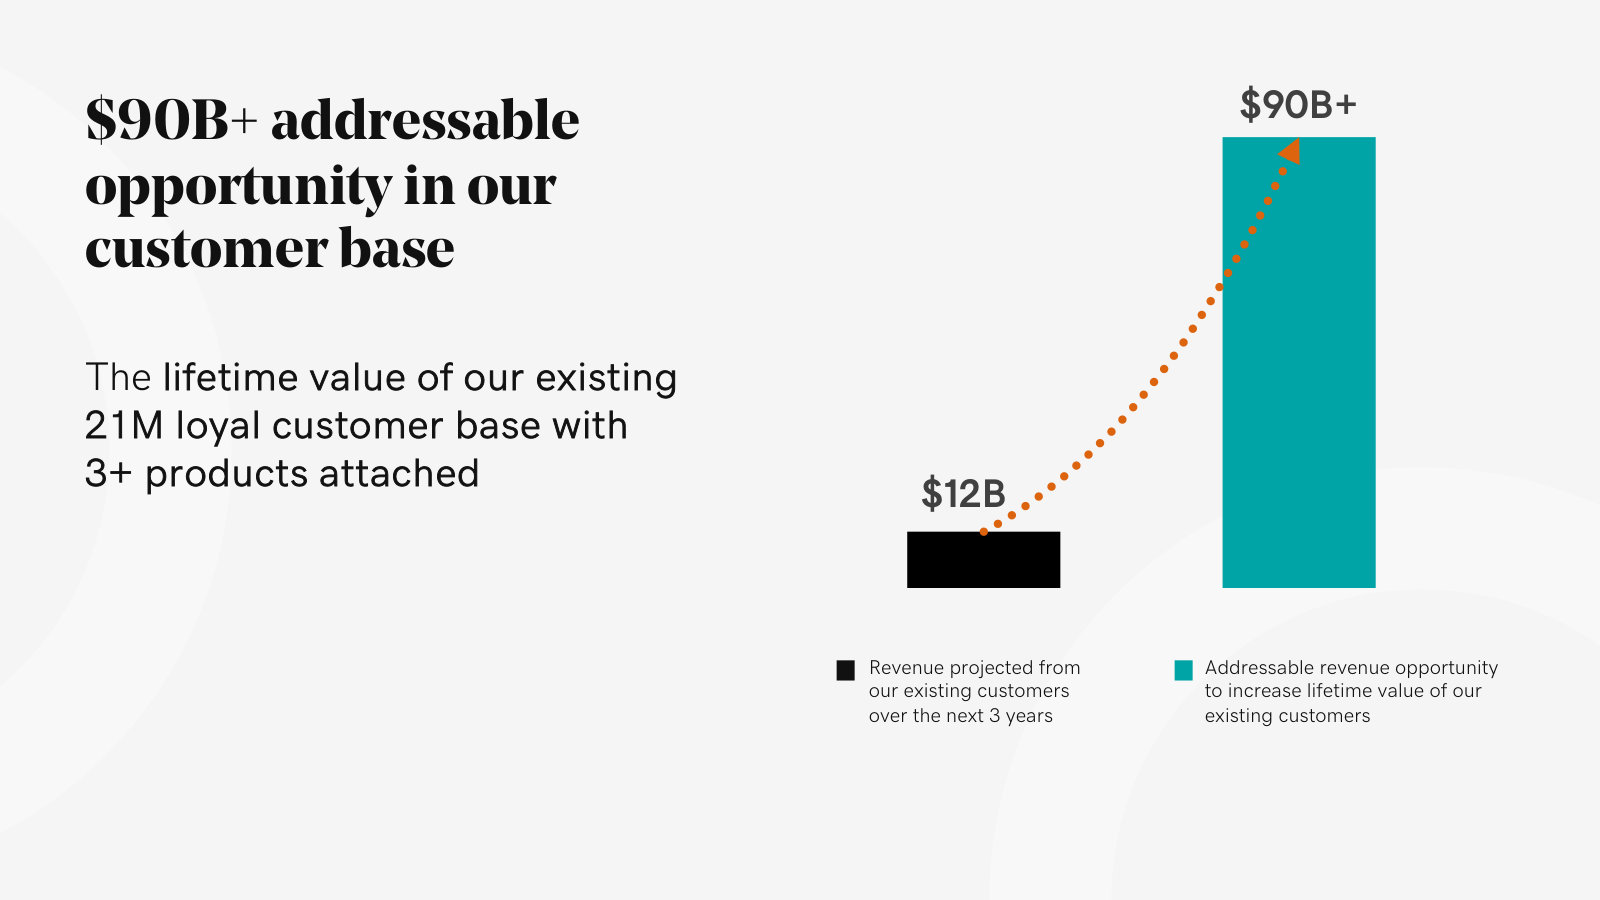
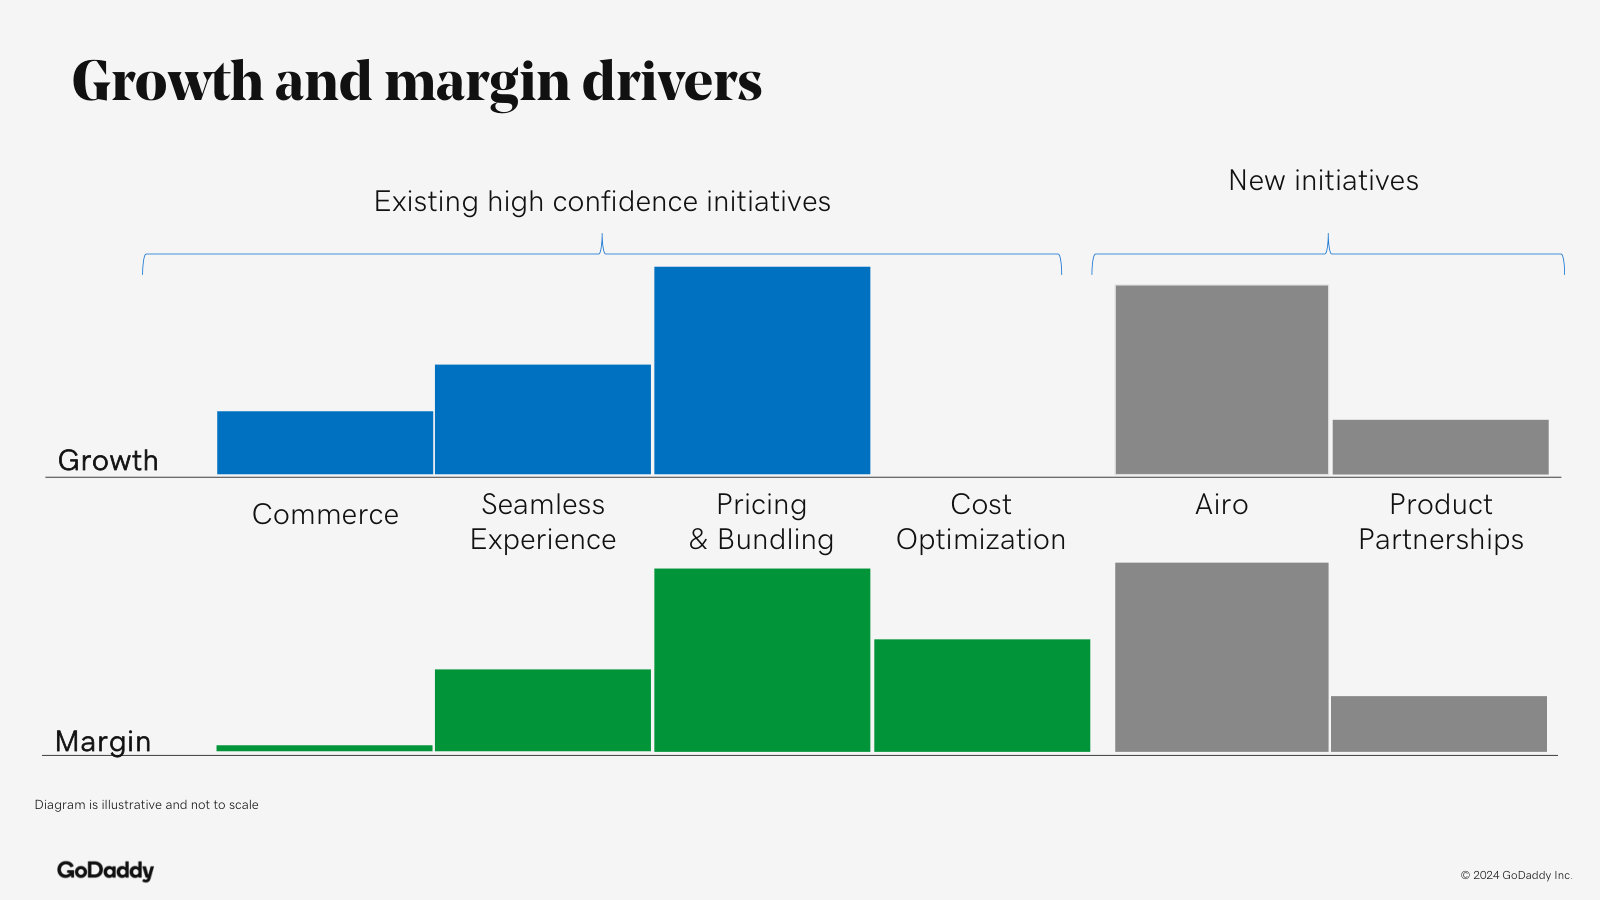
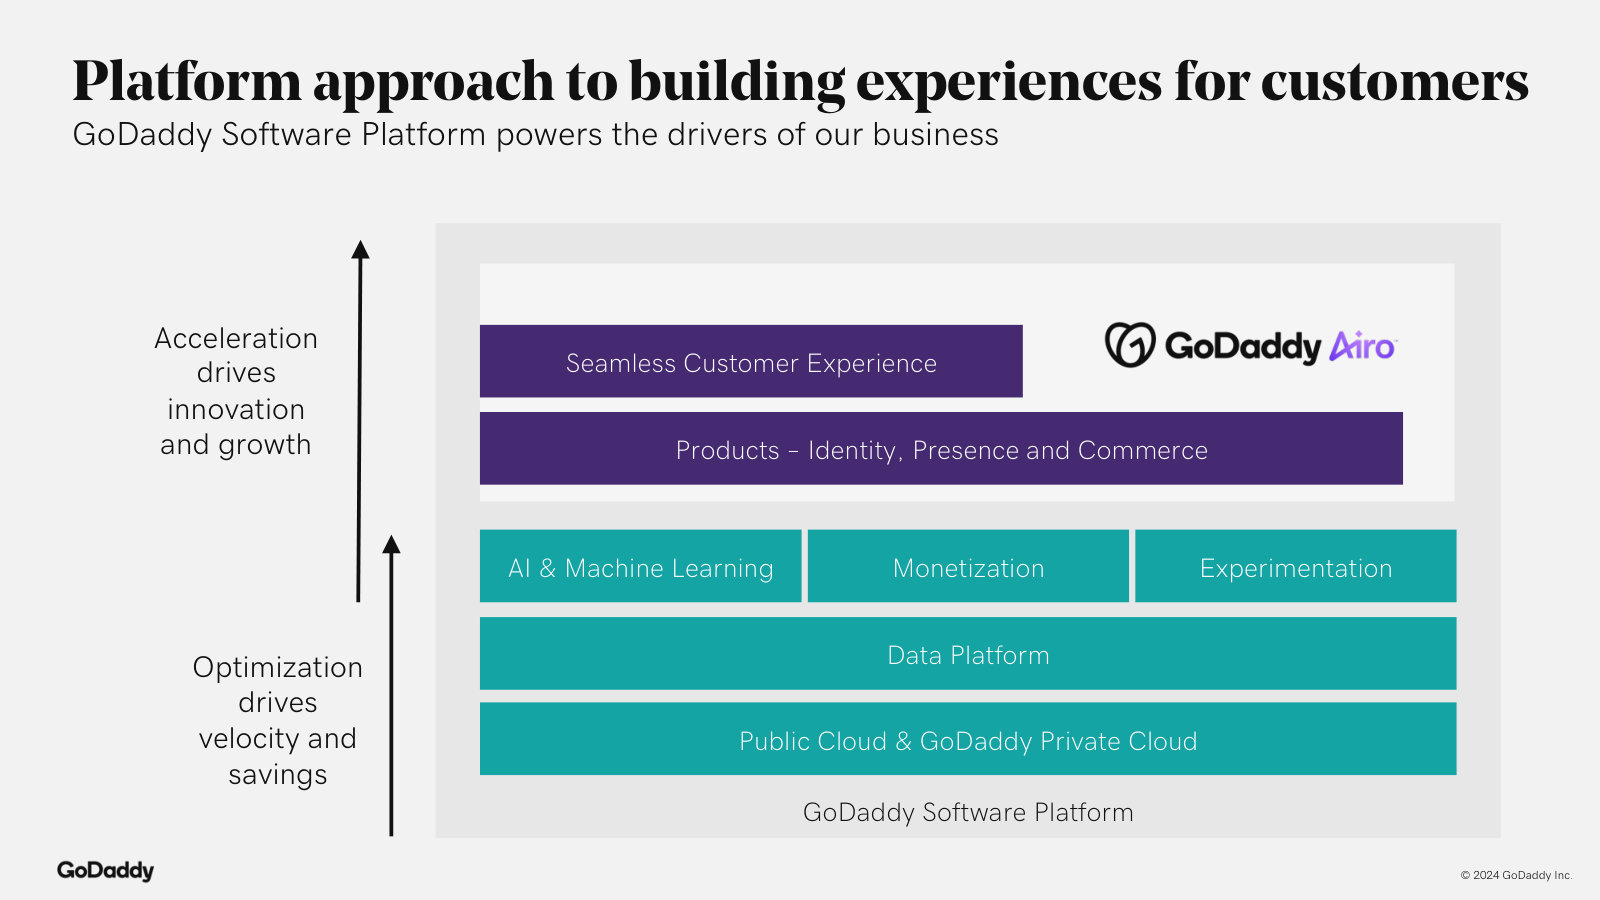
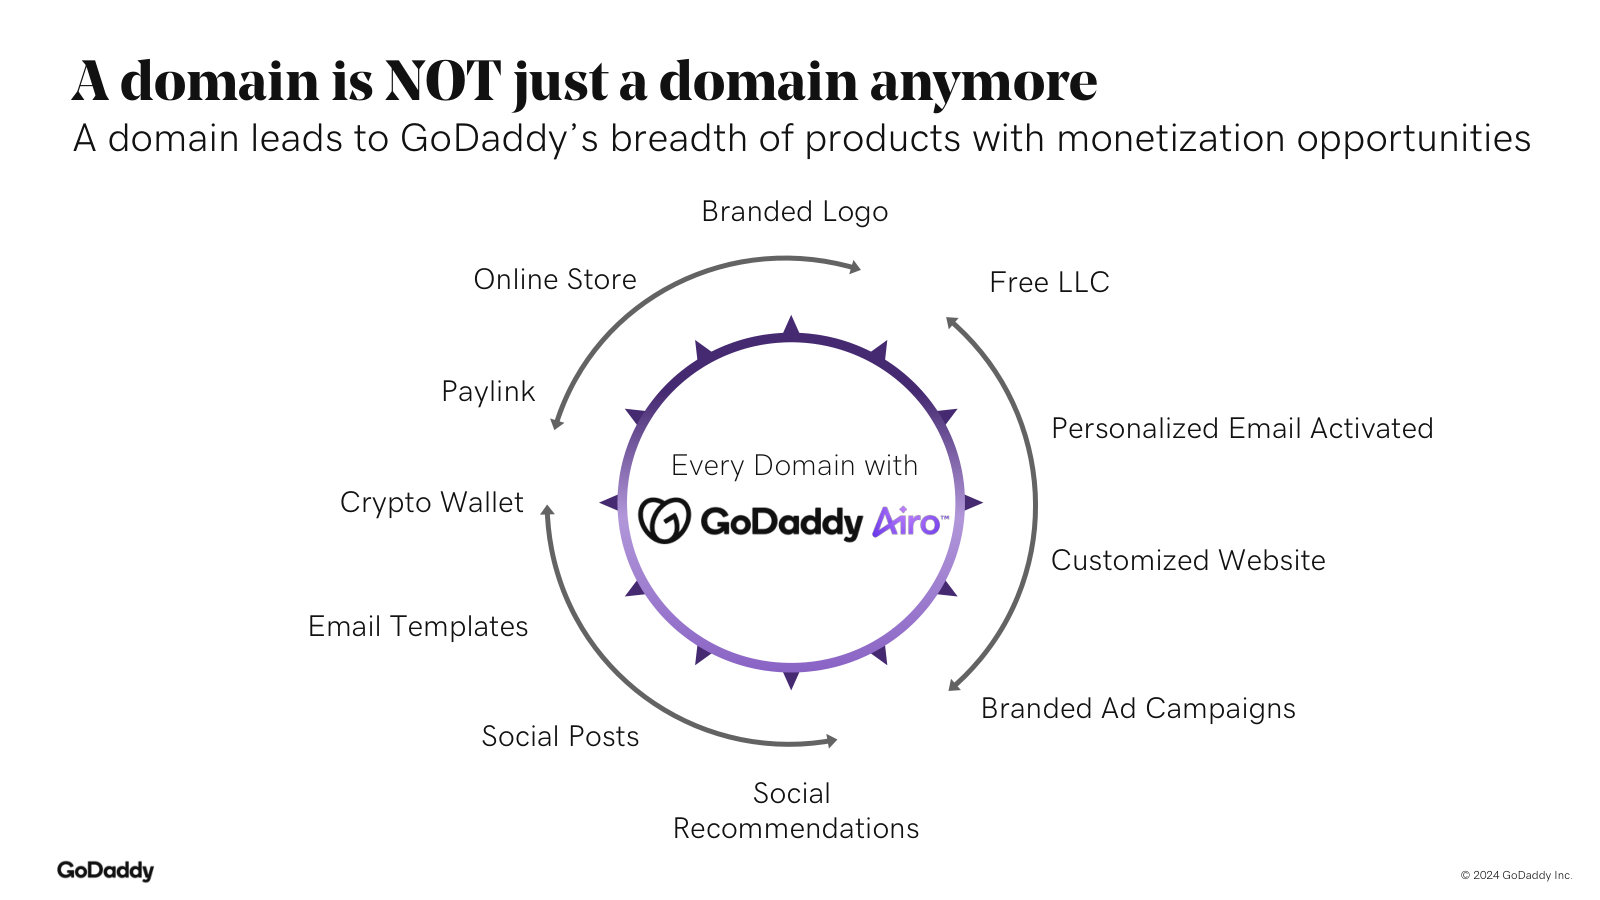
Management's fullest exposition of the business model, competitive advantages, segments, unit economics and the 2024–2026 financial framework. · Open the full document →
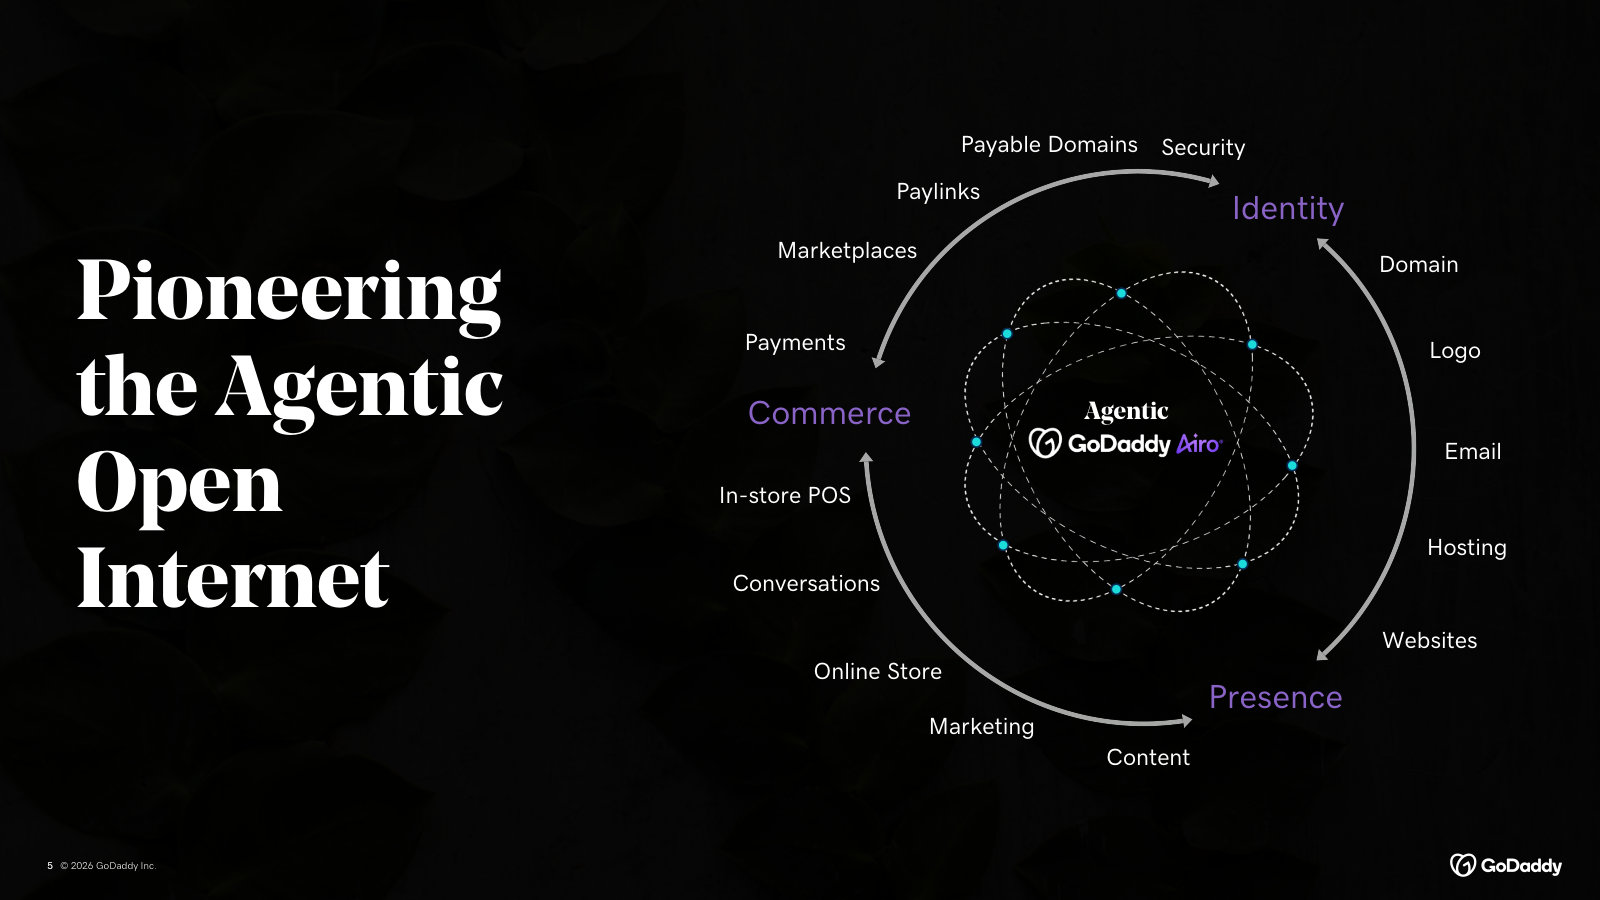
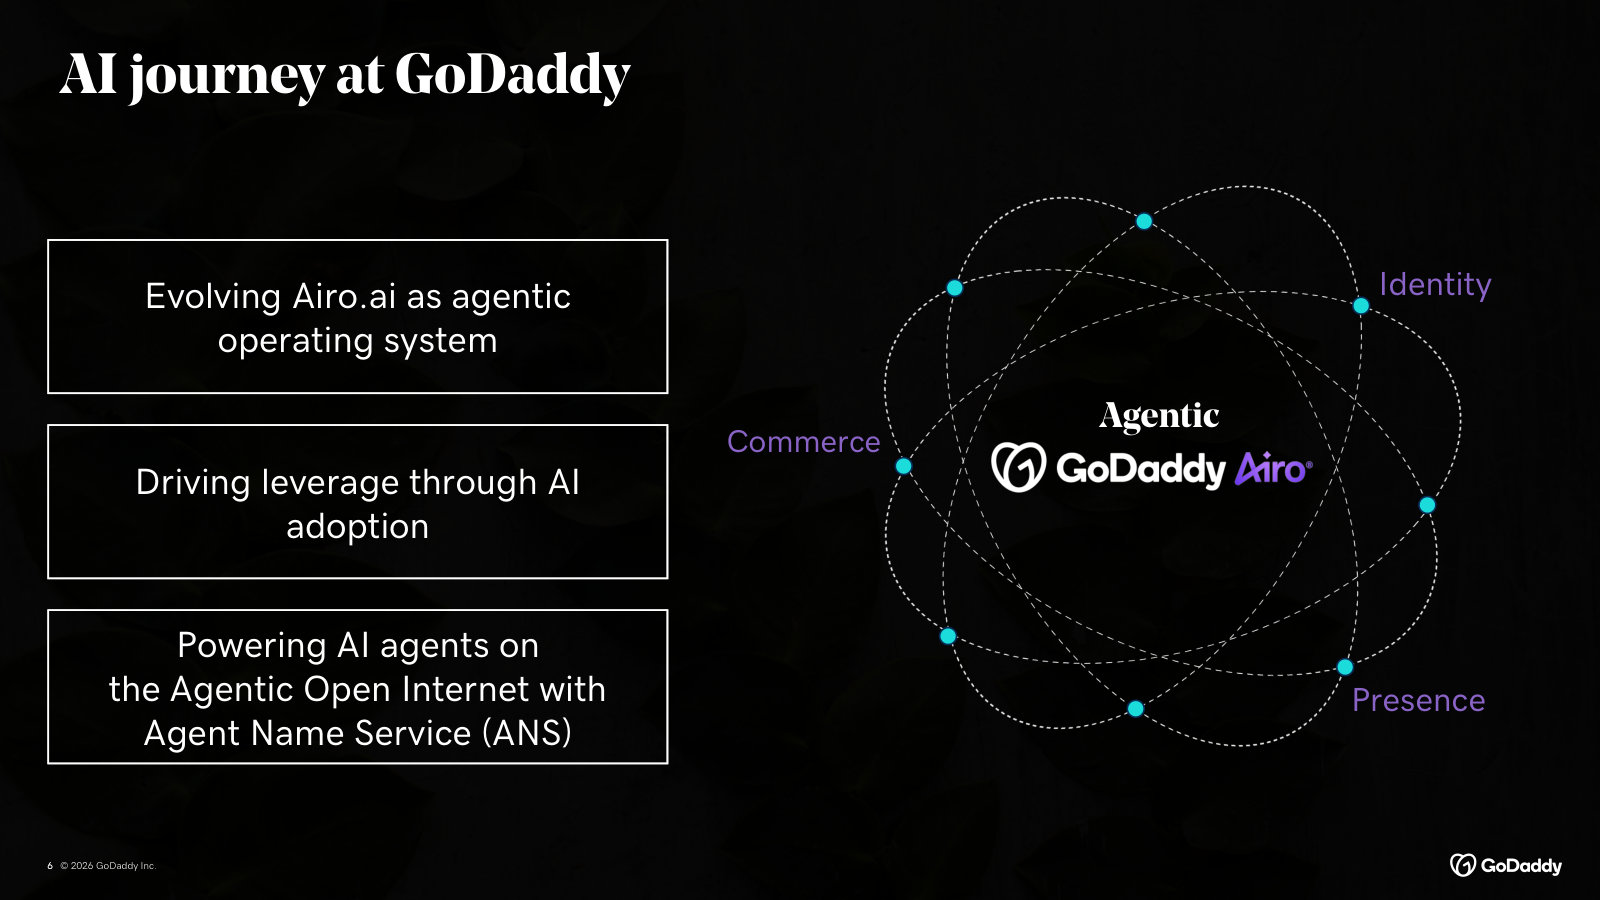
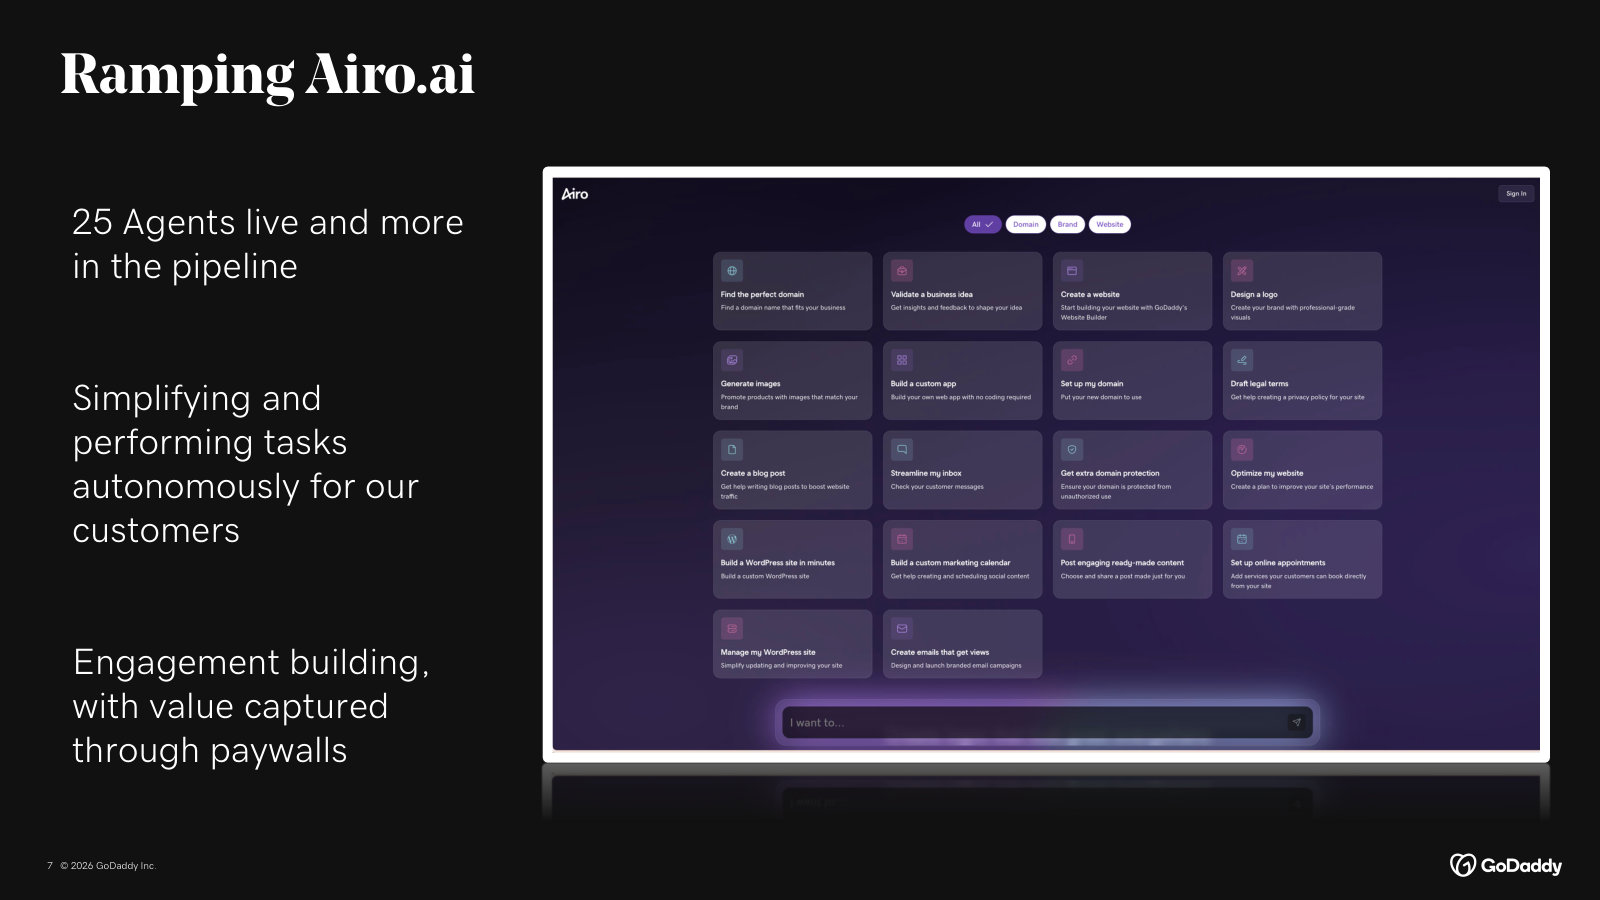
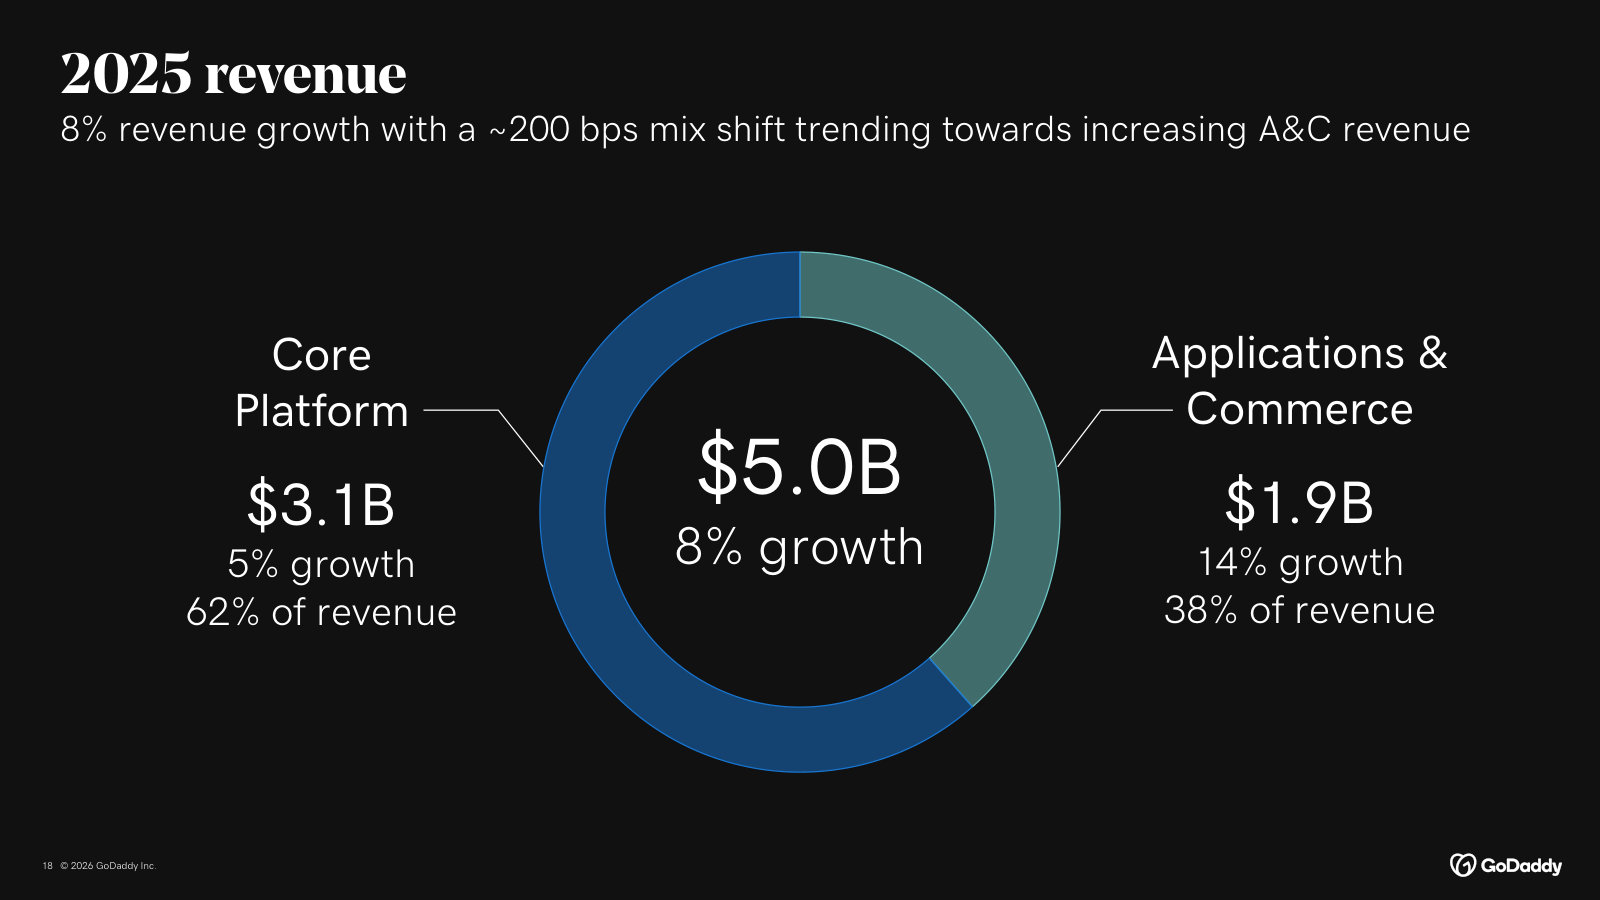
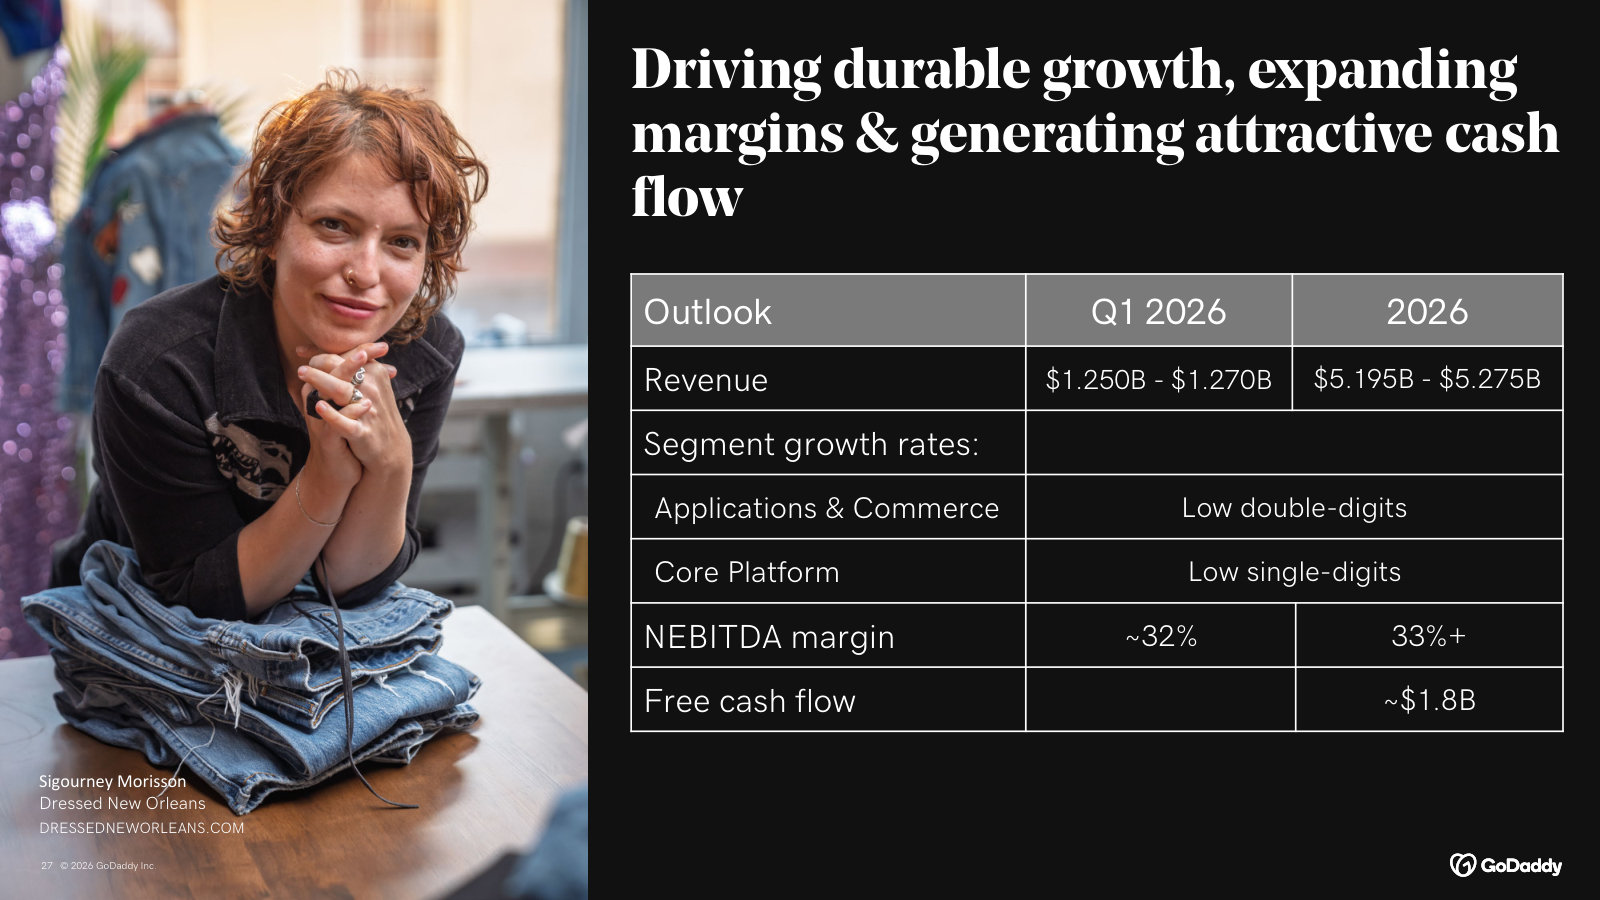
Q4 & Full-Year 2025 Earnings Results — Q4 / FY 2025
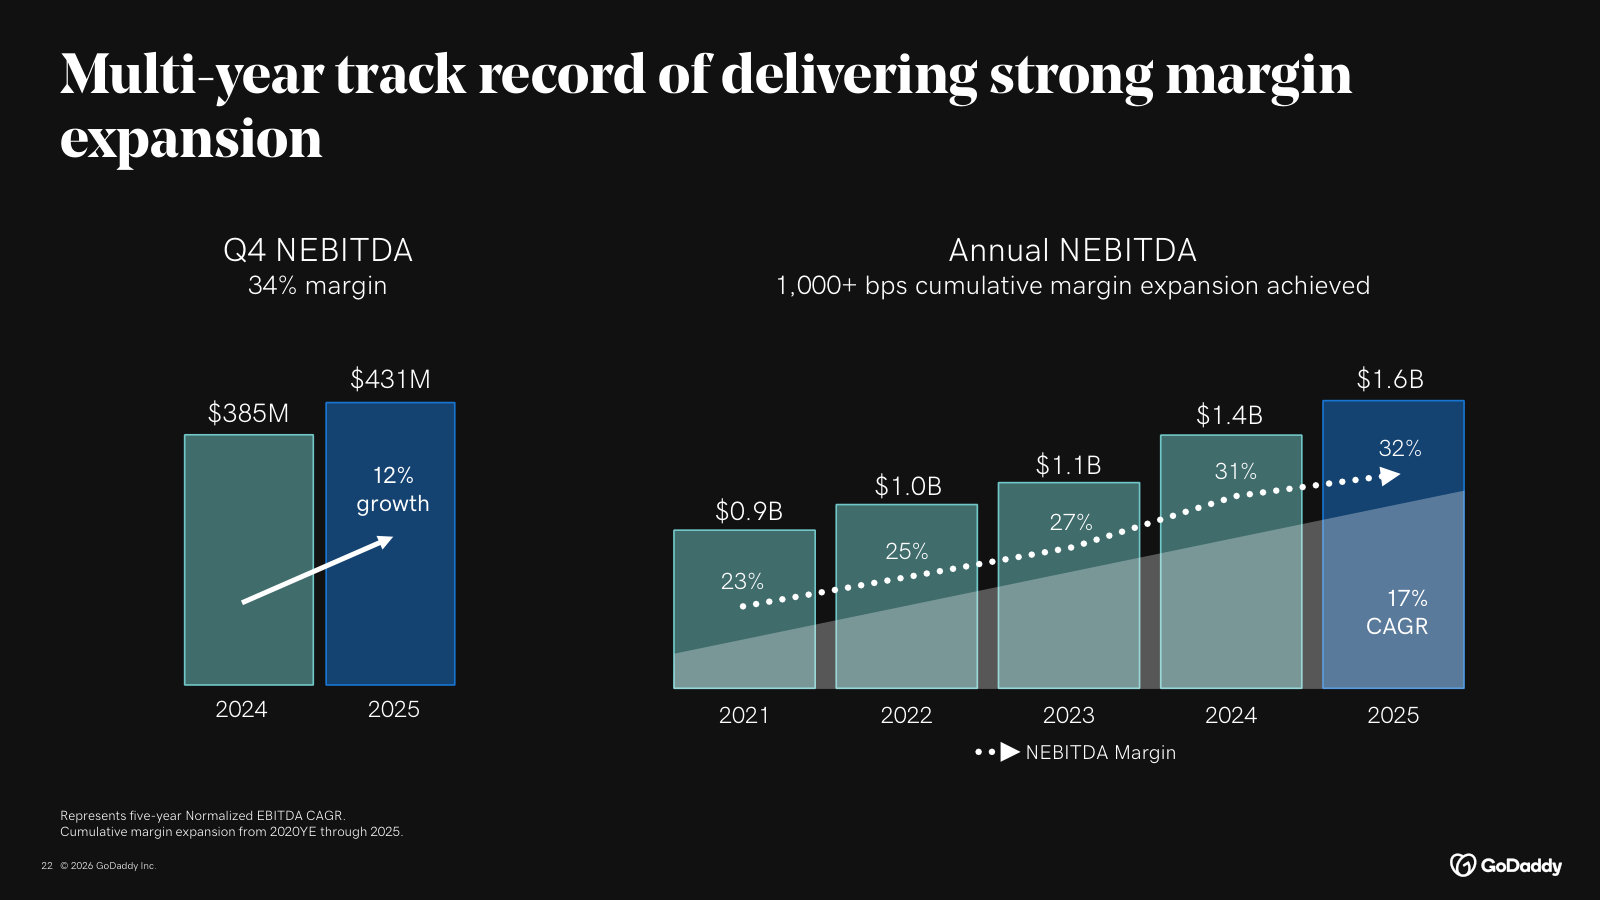
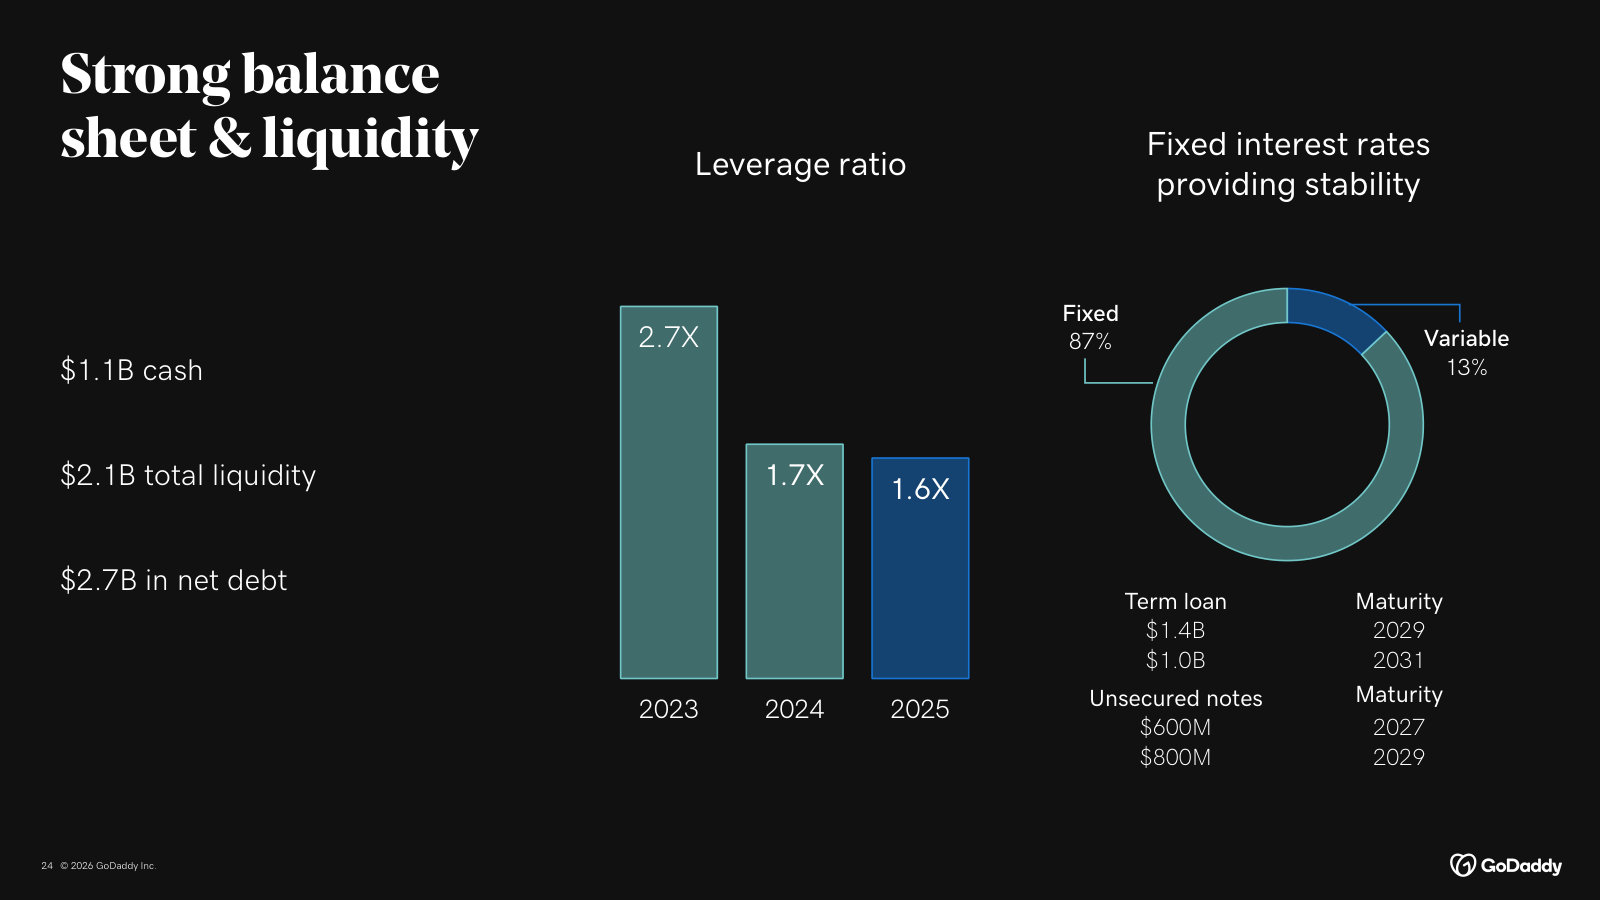
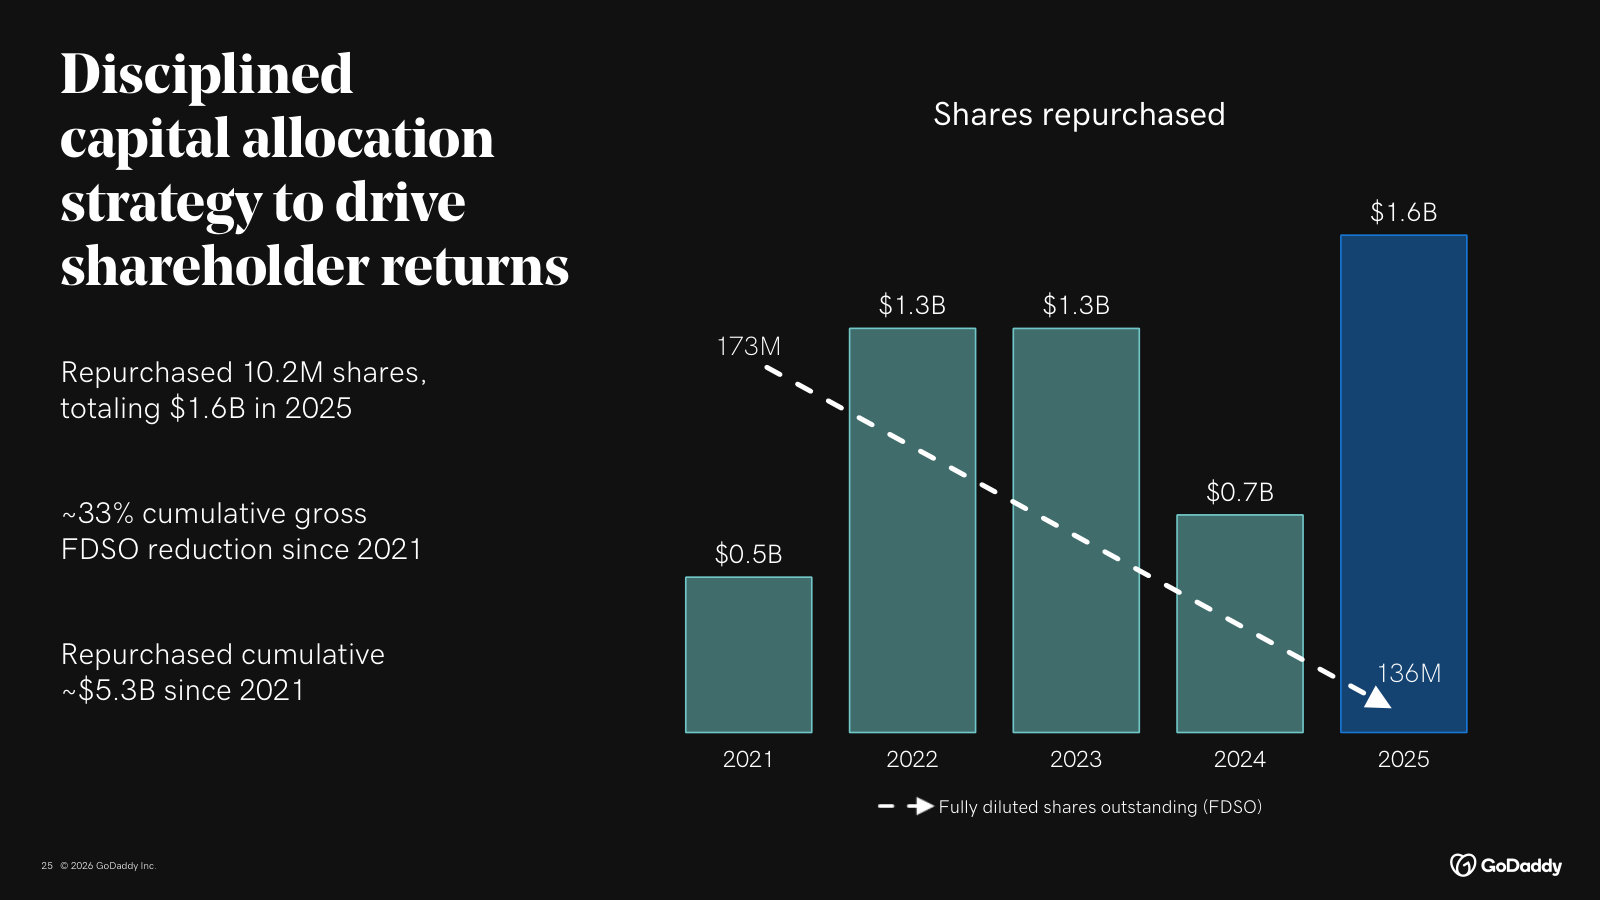
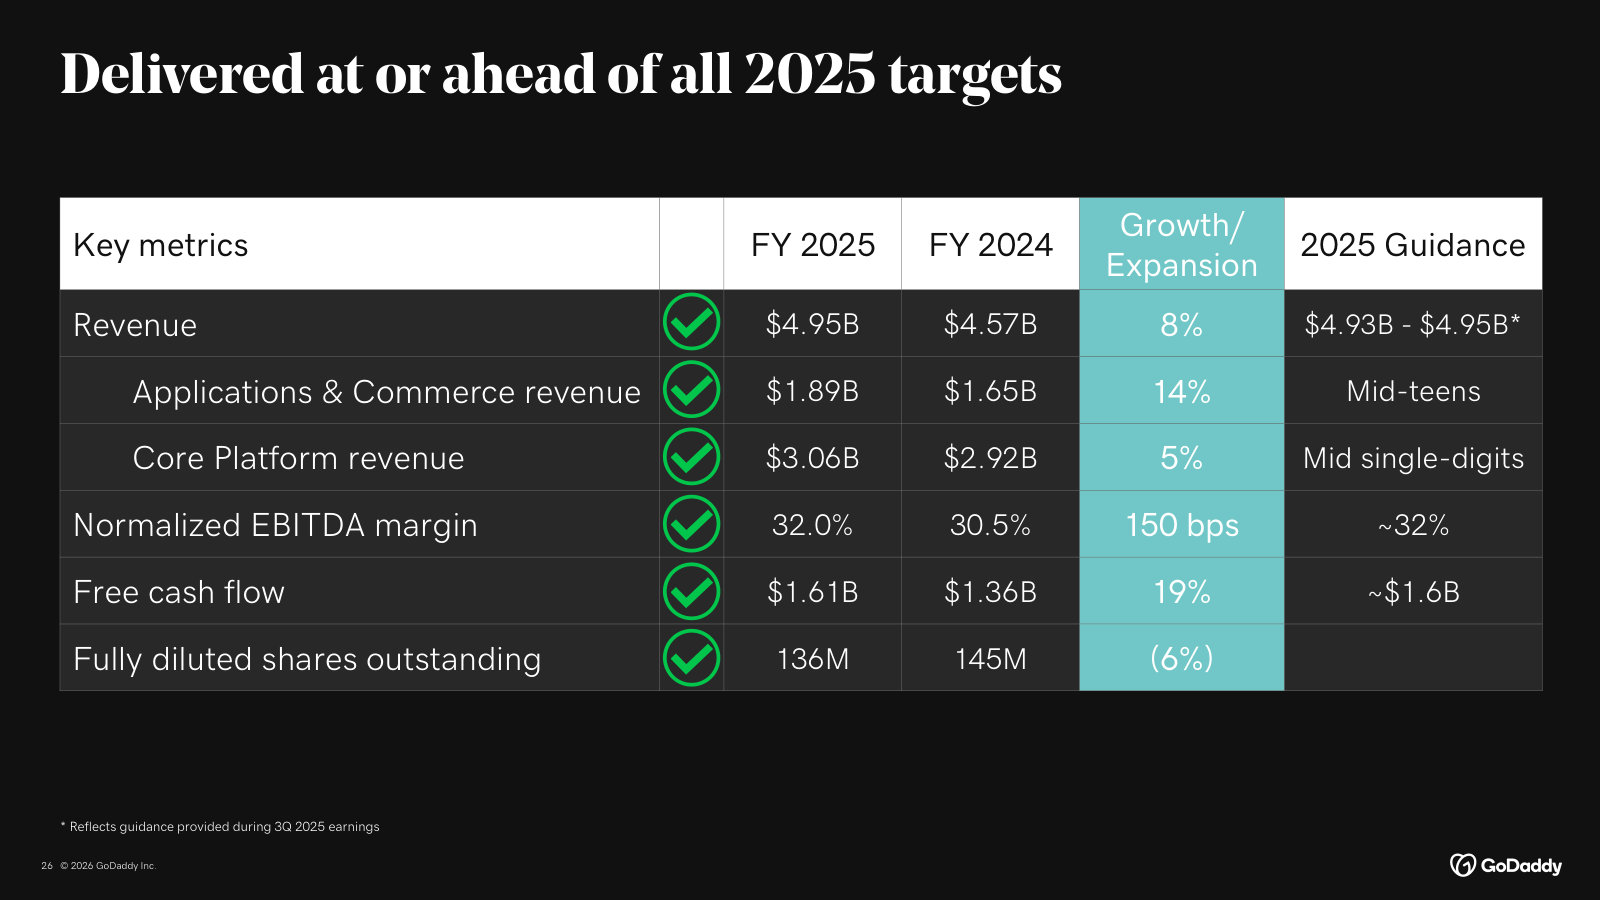
The current annual scorecard, plus management's fullest statement of the agentic-AI pivot made since the 2024 Investor Day. · Open the full document →


More from management
Q1 2026 Earnings Results — Q1 2026 · 36 pages · The latest quarter — most recent numbers, the refreshed investment thesis, and early Airo AI Builder traction ($10M+ run rate). · Open →
Q3 2025 Earnings Results — Q3 2025 · 38 pages · Where the 'Agentic Open Internet,' the .ai launch and the Agent Name Service were first laid out in detail. · Open →
GoDaddy Inc.'s management answers for the business every quarter. These are the exchanges that explain it best — verbatim, from the call transcripts preserved in Sources. Each link opens the full transcript at that page in a new tab.
GoDaddy Q1 2026 Earnings Call — Q1 FY2026
Most recent call: how high-intent customers drive attach/ARPU, A&C vs Core economics, buyback-led capital allocation, and early Airo AI Builder traction. · Open the full transcript →
Segment structure and unit economics: A&C vs Core Platform margins, ARR mix, and the Airo-driven lift in $500+ customers.
Mark McCaffrey, CFO: For our high-margin A&C segment, we drove 12% growth in revenue to $0.5 billion on continued solid attach of our subscription-based solutions. A&C ARR grew 10%, and this segment now represents approximately 40% of our total business. Segment EBITDA margin improved 110 basis points to 45% on product mix. Our Core Platform segment delivered revenue growth of 3% to $769 million, on 5% growth in primary domains with a stronger mix towards higher-priced non-.com TLDs. This was partially offset by softness in non-core GoDaddy hosting, the .CO registry contract expiration and tougher compares in aftermarket. Segment EBITDA margin expanded 150 basis points to 33% on product mix. […] And our newer Airo cohorts are demonstrating that higher value with second product attach accelerating 30% faster relative to non-Airo cohorts. These cohorts are contributing to the increase in the number of customers spending more than $500 annually, which represents approximately 10% of our customer base. Higher attach and retention rates above 85% drove ARPU growth of 9% to $246.
p. 3 · Read in context →
Capital-allocation and cash framework: over 95% of free cash flow to buybacks, above 1:1 EBITDA conversion, and a 20% free-cash-flow North Star.
Mark McCaffrey, CFO: Free cash flow grew 15% to $474 million, with a normalized EBITDA to free cash flow conversion of greater than 1:1. […] Since 2022, our share repurchase programs have resulted in a gross reduction in fully diluted shares outstanding of over 31%. And we ended the quarter with 133 million shares outstanding. […] For the full year, we expect normalized EBITDA to maintain a greater than 1:1 conversion to free cash flow, and we reaffirm our full year free cash flow target of approximately $1.8 billion. We continue to be on track to exceed our free cash flow North Star CAGR of 20%. On capital allocation. We operate within a disciplined, return-based framework and have deployed greater than 95% of our free cash flow over the last four years towards share repurchases.
p. 4 · Read in context →
How GoDaddy measures customer quality (high intent) and its philosophy for splitting AI efficiency gains between margin and reinvestment.
Vikram Kesavabhotla, Baird; Amanpal Bhutani, CEO; Mark McCaffrey, CFO: The way we define high intent is by looking at the traffic coming in by channel and then looking at the activation and attach of other products. And what we know from years and years of data across our 20 million customers is that if we see that activation and attach of other products, we are going to see good renewal at the end of the one-year term. […] we have the ability to expand our margins; we have for the past few years. We're continuing to see operational efficiencies by the adoption of AI internally. And then we're paying attention to the disciplined approach we've had in the past around investing in innovation, but using data points that show our path to return before we invest.
p. 5 · Read in context →
Airo AI Builder monetization mechanics — subscriptions plus credits, still-untapped domain/website funnels, and hosting as a differentiator.
Hoi-Fung (Ken) Wong, Oppenheimer; Amanpal Bhutani, CEO: When we talk about the $10 million run rate, we're really talking about annualized bookings. This is very early data. This includes both subscriptions and credits or tokens. We see customers come in by a subscription, engage with the product, enjoy the product, and they keep coming back […] We just started selling it in Care. We're going to add paid marketing starting this month. We also have the large funnels with domains and website paths which we haven't fully leveraged yet. […] Airo AI Builder does use GoDaddy hosting. It's one of our competitive differentiators. We can provide hosting at scale that's secure and cost-effective.
p. 6 · Read in context →
Hardest question: pressed for Airo unit economics — transaction size, credit-vs-subscription split, margin vs Websites + Marketing; management declines specifics.
Mark Zgutowicz, Benchmark; Amanpal Bhutani, CEO: You just closed $10 million in annualized bookings run rate for Airo AI Builder within weeks of beta. Could you break down the unit economics there? What's the average transaction size? How much of that run rate is coming from credit top-ups versus the initial plan purchase? And what's the margin profile relative to legacy Websites + Marketing? […] From day one, we've designed this product to be gross margin positive and to deliver appropriate economics. Regarding subscription versus credits, we're very early; this needs to bake and grow. […] It's too early to provide detailed disclosures on the split between subscription and credits.
p. 7 · Read in context →
Competitive positioning: a domain/DNS-based right to win in Agent Name Service, and willingness to let low-LTV domain customers go.
Eleanor Smith, JPMorgan; Amanpal Bhutani, CEO: GoDaddy has a strong right to win because within the ANS open standard we use the Domain Name System for discovery. DNS is a universal directory that replicates everywhere; agent registries are appearing across companies, and connecting those registries to the single DNS directory enables broad discovery. […] We have said we will let lower-LTV customers go because our focus is on high-intent customers. […] Our experience shows that value is in the high-intent customer: someone who buys a domain and then uses other products. That behavior drives LTV for GoDaddy and drives our business.
p. 9 · Read in context →
GoDaddy Q4 and Full Year 2025 Earnings Call — Q4 & FY2025
Annual call: the domains-to-attach LTV flywheel, the $500 cohort, AI cost discipline, and the 2026 .com go-to-market's bookings-vs-revenue trade-off. · Open the full transcript →
Segment economics and the funnel: A&C (47% margin) vs Core Platform, with domains as the front door and Airo driving attach.
Mark McCaffrey, CFO: For the Applications & Commerce segment, we drove 13% growth in revenue to $498 million on continued solid adoption and attach of our subscription-based solutions. Segment EBITDA margin improved 40 basis points to 47%. A&C ARR grew 12%. Our Core Platform segment delivered revenue growth of 3% to $776 million, driven by the continued strength in aftermarket, up 8% as well as 5% growth in primary domains, partially offset by the softness in non-core GoDaddy hosting. Segment EBITDA margin expanded 70 basis points to 35%. […] Domains remain the front door to our platform, attracting high-intent customers at a pivotal moment in their journey. Airo personalizes the experience that follows, accelerating discovery and increasing attach across identity, presence, and commerce.
p. 3 · Read in context →
The durable-growth engine: Airo LTV lift, the $500 cohort with near-perfect retention, ARPU flywheel, and 1,000 bps of five-year margin expansion.
Mark McCaffrey, CFO: the velocity of a second product attach accelerated by nearly 30% relative to non-Airo cohorts. This dynamic is expanding lifetime value across our customer base. We see this most clearly in our highest value cohorts who spend more than $500 annually, which grew 11% and that represent approximately 10% of our total base. These customers have meaningfully higher second and third product attach rates and near-perfect retention. The result is compounding value creation with ARPU increasing 10% to $242 and overall retention rates rising above 85%. […] Over the past five years, cumulative margin expansion of 1,000 basis points reflects our ability to scale efficiently while continuing to invest in the business. This margin expansion flows through directly to cash generation. Free cash flow grew a robust 19% to $1.6 billion with a normalized EBITDA to free cash flow conversion of greater than 1:1.
p. 4 · Read in context →
Capital allocation and 2026 guidance: 100% of FCF to buybacks, ~33% cumulative share reduction, and the sizing of the 2026 revenue headwinds.
Mark McCaffrey, CFO: In 2025, we deployed 100% of our free cash flow, repurchasing 10.2 million shares totaling $1.6 billion while maintaining our balance sheet strength. Since 2021, our share repurchase programs have resulted in a gross reduction in fully diluted shares outstanding of approximately 33% and we ended the year with 136 million shares outstanding. […] With this, our full year revenue outlook incorporates just over 200 basis points of cumulative impact from the expiration of the .CO registry contract, the continued exclusion of high-value aftermarket transactions, and the go-to-market and product evolution we spoke about. The .CO and aftermarket impacts represent approximately two-thirds of this amount, while one-third is from the go-to-market and product evolution. […] We expect to drive free cash flow of approximately $1.8 billion, maintaining greater than a 1:1 conversion for the full year.
p. 4 · Read in context →
Hardest question, answered: whether the 2026 .com promo is a one-time or structural bookings drag, and why it barely touches revenue.
Mark McCaffrey, CFO (to Vikram Kesavabhotla, Baird): […] look at it from the multiyear terms to the annual terms. This is impacting our bookings, but has relatively little impact on revenue itself because the timing of the revenue recognition stays consistent. So that's one aspect of it. The other is there is a reduction in our average order size at initiation related to the discount that gets allocated amongst all the products, that does have a little bit of impact on revenue in and of itself. As time goes on, volume picks up, we get better at this offer. We think the major impact is going to be at the end of this year and going into Q1, but we expect that bookings to be in parity for the most part with revenue by the time we get to the end of the year.
p. 5 · Read in context →
AI cost economics: a single cost interface plus in-product cost optimization let GoDaddy fund more AI while holding its margin guidance.
Amanpal Bhutani, CEO: even as we look to invest in AI or the AI products, as we talked today, we have a couple of exciting product launches powered by AI, all of those sort of followed two core things. One, all the AI costs go through one interface so that we are able to stay on top of it very, very closely. It doesn't matter if that's a developer. It doesn't matter if it's one of the products that our customers are using. And two, we are very focused on solving for the objective function where we create products that are at a cost that works for our customers. So what you'll continually see in our products is an already optimized AI solution that then leads to lower costs than what you might see at some other companies. So those two things together, the visibility and the operational focus on it and the technological difference of just optimizing for that right within the product is what gives us confidence that we can continue to maintain the margin guidance that Mark has talked about while continuing to fund more and more use of AI, both within the company and with our products.
p. 6 · Read in context →
Competitive read on AI entrants: vibe-coding tools target enterprise/agency users, not GoDaddy's micro-business funnel — domains-plus-attach stays the moat.
Arjun Bhatia, William Blair; Amanpal Bhutani, CEO: When I look at the competitors in the AI space, we still continue to see a lot of that focus being on enterprise employees, like product managers, people that work within enterprises or people that are a little bit sort of working for agencies or companies like that. We see less of that behavior with our direct customer, the person who is the roofer, the cleaner, some micro business owner. So we see less of that. Our expansion of go-to-market is really about being able to bring more high-intent customers into the domains funnel, which is our largest funnel and then attach to it very well. […] I'm not suggesting that we are immune to what's happening in the world, we just have not seen a very large impact of that in our funnel yet or at this time.
p. 11 · Read in context →
GoDaddy Q4 and Full Year 2023 Earnings Call — Q4 & FY2023
The Airo launch call: first controlled-experiment monetization results, the A&C attach flywheel, and the FCF-per-share capital-return engine. · Open the full transcript →
Airo's first controlled experiment: the test cohort monetized above control via attach and mix shift to higher-price/margin products.
Aman Bhutani, CEO: On GoDaddy Airo, I have an update on its performance since launch. I am happy to share that in a controlled experiment, customers that were part of the first test cohort for the Airo experience monetized at rates higher than those customers in the control group that were not exposed to the Airo experience. The increased monetization was due to attach and shifting the mix towards higher price and higher margin products. This is particularly encouraging because significant customer experience changes like Airo typically take many months of iterative improvement to outperform the control group. With this initial promising result, we have rolled out GoDaddy Airo to more customers in the U.S. We have also launched tests in international markets a few days ago.
p. 2 · Read in context →
Segment unit economics: A&C is the high-margin engine — 13% revenue growth, 44% segment EBITDA margin, and GPV more than doubling to $1.7B.
Mark McCaffrey, CFO: Beginning with Q4 results, our high margin Applications and Commerce revenue grew 13% to $377 million and we delivered an expanded segment EBITDA margin of 44%, increasing 100 basis points since last quarter and 300 basis points since last year. ARR for Applications and Commerce grew 10% to $1.4 billion and our Create + Grow ARR was up 8% to $481 million. In Commerce, we drove significant growth in annualized GPV to $1.7 billion, more than doubling last year's performance as conversion of our existing customers to the GoDaddy software platform remains strong.
p. 2 · Read in context →
Capital-return engine plus the retention thesis: FCF/share +21%, over 20% share reduction ahead of schedule, and two-product customers giving pricing power.
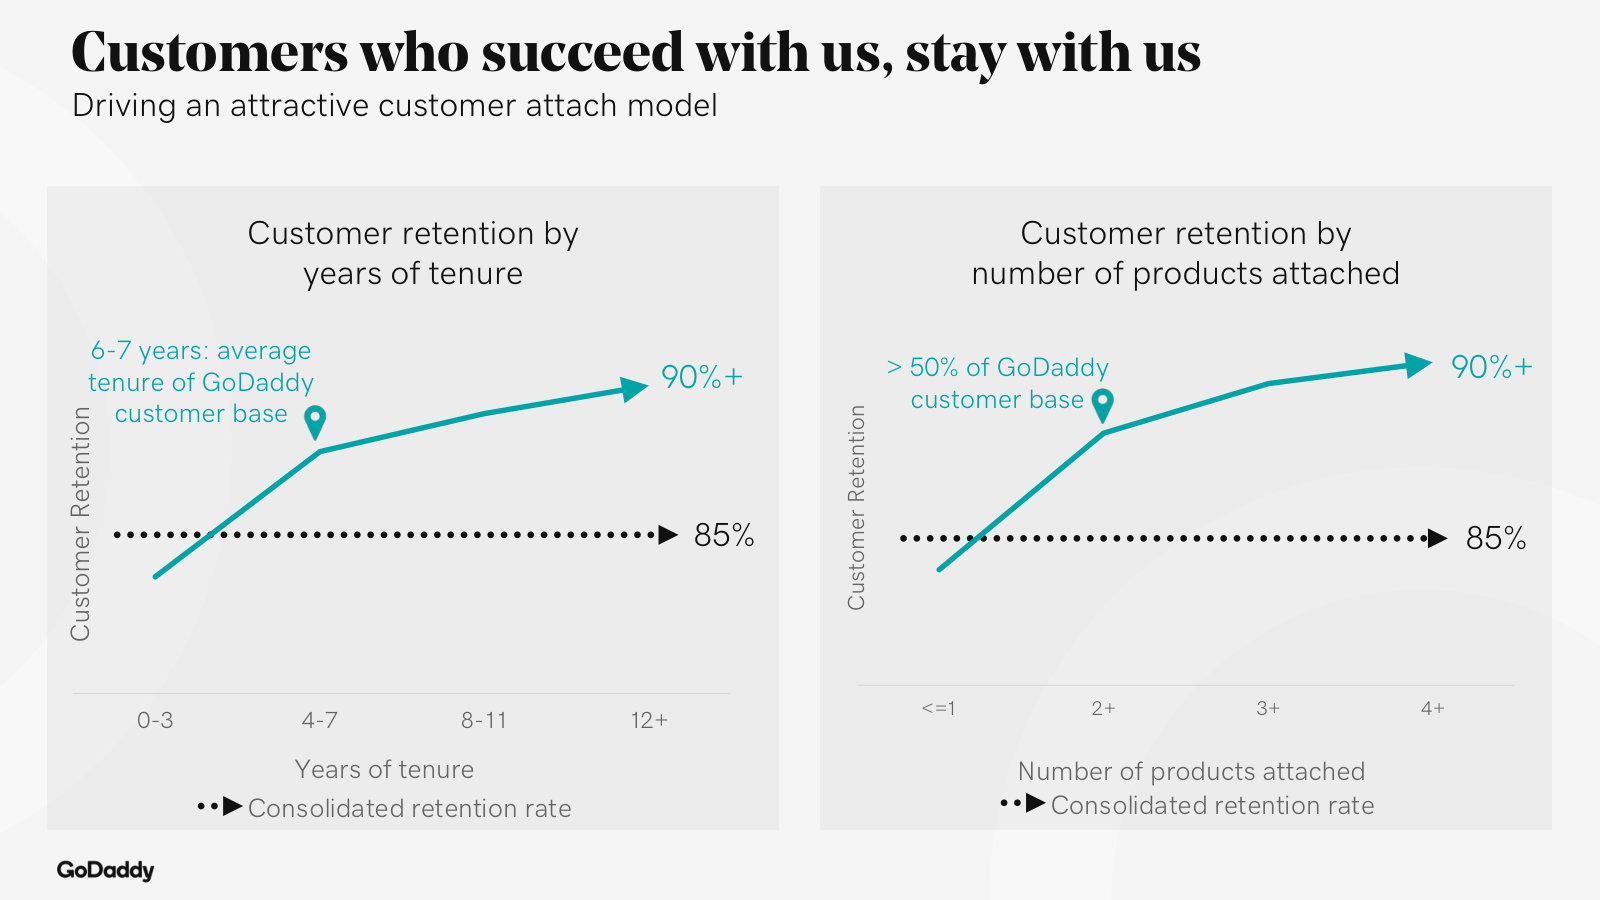
Mark McCaffrey, CFO: Additionally, the cumulative shares repurchased under our current authorizations totaled $2.6 billion, representing 34.2 million shares retired. This reduced our fully diluted shares outstanding since the inception of these authorizations by over 20%, achieving our three-year targeted reduction ahead of schedule. […] Customer retention remains 85% as we drove improvements in 2+ product attach, with greater than 50% of our customers paying for at least two products. These high-quality customers are stickier and give us greater pricing flexibility.
p. 3 · Read in context →
The attach flywheel quantified: second product → 85% retention, third product → 'almost a customer for life'; A&C bookings growing double digits across the board.
Mark McCaffrey, CFO; Aman Bhutani, CEO; Vikram Kesavabhotla, Baird: On A&C, the growth drivers, and we talk about this a lot, is we're seeing the demand move to that second product much faster than we had ever seen. And then now we're seeing it to the third product much faster than we've ever seen. So that shows up in our A&C growth. That's our higher profitability segment as well. […] We've talked about once we get to the second product, our average retention is 85%, but it goes up from there. If we get customers to a third product, it goes up significantly. It's almost a customer for life. So, those are the things that are driving the momentum in A&C right now
p. 7 · Read in context →
Airo monetization beyond attach: new paywalls GoDaddy has never run (e.g. premium logos), with 21M customers and 14M interactions feeding pricing.
Aman Bhutani, CEO; Evercore ISI: In terms of product attach and other monetization means, of course, product attach is the first level we're looking for. But as we'll share a little bit at our Investor Day, we're also looking for new monetization methods. And I'll just give you an example. One of the things that we want to test is a premium offering for logo building. […] And we're going to test a new paywall for it and a new monetization method that GoDaddy has never done before. […] And with 21 million customers, 14 million interactions with them, we get a lot of data about how they're getting value out of our products, which creates a lot of opportunity going forward around pricing bundles, elasticity around that, seeing the value they're driving.
p. 8 · Read in context →
Hardest question: why is net customer growth only ~1% vs 2-4% historically? A deliberate intent-based trade-off, shedding low-intent single-product customers.
Mark McCaffrey, CFO (to Ygal Arounian, Citigroup): When we look at our customers, we've always said we are targeting customers with a higher intent to do something when they come into the funnel, add that second product, start that business, generate value for themselves, and therefore generate value for us. What we've seen coming out of '23 and continuing into 2024 at the gross ads level is that consistent, strong demand that we've talked about all year and that continuing. And to put it in perspective, '23 gross customer ads was higher than 2022, right? And so not only are we seeing an increase there, we're seeing it more consistent from quarter to quarter and more stable. […] And we're seeing through the divestitures, we are losing customers, but they are generally customers that were low intent customers. So they were on a single product, maybe weren't doing things, hadn't done things for years. So that trade off is in there and continues to be something that we are working through on a net customer ad basis.
p. 9 · Read in context →
GoDaddy Q2 2022 Earnings Call — Q2 FY2022
Where the two-segment model (Applications & Commerce vs Core Platform) and the FCF-per-share buyback framework are laid out, plus the high-LTV pricing discipline. · Open the full transcript →
The Applications & Commerce segment defined: growth range, drivers, and ARR — the high-margin half of the two-segment model.
Mark McCaffrey, CFO: Applications and Commerce revenue grew 15% within the target range of 14% to 16%, driven by continued strength in our Create and Grow products and Email attach. The ARR for Applications and Commerce grew 12% to more than $1.2 billion. And within that, the ARR from our Create and Grow products grew 10% to $420 million.
p. 7 · Read in context →
Core Platform plus the capital-return math: unlevered FCF +16%, $1B of buybacks retiring ~8% of shares, FCF/share +19%, net leverage in range.
Mark McCaffrey, CFO: Unlevered free cash flow for the quarter totaled $274 million growing 16%, driven by strong profitability. Additionally, year to date, we completed $1 billion of share buybacks, repurchasing 12.8 million shares and reducing our fully diluted share count by approximately 8% since year-end. Free cash flow per share rose to $5.67 on a trailing 12-month basis versus the prioryear cash flow per share of $4.78, a 19% increase on strong cash flow and share repurchases. […] Net debt stands at $3.1 billion at the midpoint of our targeted range of two to four times.
p. 8 · Read in context →
How to read FX and pricing: currency hits bookings not costs, and price changes are tested nuanced by geography rather than rolled out globally.
Mark McCaffrey, CFO; Aman Bhutani, CEO; Trevor Young, Barclays: And then on pricing, yes, what you saw, Trevor, was us testing some changes, and those were the price test for Websites + Marketing. In terms of taking that international, as I've shared before, the price testing for us is quite nuanced. We base it on geography, on sort of customer expectations changing on market share. So you'll see it appear in certain geographies, but not in others. […] So most of the impact on the FX affects our bookings, our costs are pretty much fixed and in line with the U.S. dollar. So I would say, look for most of the FX impact to flow through to bookings and then ultimately lead to revenue with minimal impact on the cost in our structure today.
p. 11 · Read in context →
The retention thesis: products carrying large consumer surplus for high-LTV customers are the last spend they walk away from in a downturn.
Aman Bhutani, CEO (to Brent Thill, Jefferies): We add to that the fact that the products we sell create tremendous value for our customers and the price we charge, leaves plenty of consumer surplus for our customers, right? So even if they have to adapt to changing economic environment, the products we typically sell to them tend to be the last products they walk away from. So that's why we see sort of the continued high retention rates for customers.
p. 14 · Read in context →
How it makes money: bundling a payments-enabled checkout into the domain purchase itself - Commerce on every surface (the Omnicommerce ethos).
Aman Bhutani, CEO (to Mark Zgutowicz, Rosenblatt Securities): […] buy a domain, you get checkout page that you can customize that's enabled for your domain automatically. So you literally buy the domain and you can start taking payments, right? And that's a bit of a different movement in that we're not selling the product and then attaching more, we're bundling it in right with the first purchase and literally putting – and the idea there is put Commerce on every surface we have because that is, in a sense, the Omnicommerce ethos, right, like wherever you're transacting, whatever surface you're creating your commerce or your micro business is enabled in there.
p. 21 · Read in context →
Hardest question — is GoDaddy raising price on existing subs? Answer lays out the value-first pricing discipline that preserves consumer surplus.
Aman Bhutani, CEO; Naved Khan, Truist Securities: We have a large sort of broad portfolio of products. So we're constantly evaluating and doing tests and seeing where we should take price. And typically, we're taking price after we have added more value for the customer, right? We want to continue to push the willingness to pay up and then take price so that the surplus for the consumer continues to be maintained and the customer stay super happy with us.
p. 24 · Read in context →
More calls
GoDaddy Q4 and Full Year 2024 Earnings Call — Q4 & FY2024 · 16 pages · Airo's entry into the paid monetization phase (Airo and Airo Plus), the quality-over-quantity customer-base reset to 20.5M, and the 33%-margin-by-2026 path. · Open →
GoDaddy Q4 and Full Year 2021 Earnings Call — Q4 & FY2021 · 35 pages · The $3B (2022–2024) buyback authorization framed as ~80% of projected FCF, plus the ARPU/customer and transactional-aftermarket mechanics of the model. · Open →
GoDaddy Q3 2025 Earnings Call — Q3 FY2025 · 13 pages · For the most recent read before the 2026 go-to-market shift — Airo Builder ramp and momentum in the $500+ high-value cohort. · Open →
GoDaddy Q1 2024 Earnings Call — Q1 FY2024 · 13 pages · For the first full quarter after the Airo rollout and Investor Day, with early pricing-and-bundling execution against the durable-growth framework. · Open →
GoDaddy Inc.'s annual reports contain management's most considered account of the business. These are the sections, passages and visual pages worth opening in the originals preserved in Sources.
Annual Report on Form 10-K — FY2025 (year ended Dec 31, 2025)
The latest 10-K — the fullest account of what GoDaddy is, how its two segments earn money, the risks that bite and what drove the year. · Open the full document →
Item 1. Business — Overview — p. 7 · Read the full section →
Management's plain-English definition: a one-stop shop for 20.4M entrepreneurs, organized around Identity, Presence and Commerce.
Item 1 Business, p.7 — GoDaddy as a one-stop shop for 20.4M entrepreneurs across Identity, Presence and Commerce.
GoDaddy is a global leader serving a large market of entrepreneurs, developing and delivering easy-to-use solutions as a onestop shop provider, backed by proactive, informed and personalized guidance. We serve small businesses, individuals, organizations, developers, designers and domain investors. […] Our 20.4 million customers are passionate and determined to transform their ideas into something meaningful. […] We design our solutions and tools to help our customers across all aspects of their businesses and to assist them in growing across what we call the "Entrepreneur's Wheel." The Entrepreneur's Wheel represents our customers' needs within three main focus areas: Identity, Presence and Commerce.
p. 7 · Read in context →
Item 1. Business — Core Platform: Domains — p. 16 · Read the full section →
The franchise that anchors the Core segment (~62% of revenue): the world's #1 registrar, where nearly every customer begins.
Item 1 Business — Domains, p.17 — the moat: ~81M domains under management, ~21% of all domains worldwide, ~94% of customers buy a domain.
We are the global leader in domain name registration, with approximately 81 million domains under management as of December 31, 2025. Based on information reported in VeriSign's most recent Domain Name Industry Brief, this represented approximately 21% of the approximately 387 million domain names registered worldwide as of December 31, 2025. As of December 31, 2025, approximately 94% of our customers purchased a domain from us.
p. 17 · Read in context →
We face significant competition for our products, which we expect will continue to intensify, and we may not be able to maintain or improve our competitive position or market share. — p. 50 · Read the full section →
A broad, low-switching market where GoDaddy fights niche point-solutions and full-suite rivals across its product lines, amplified by AI.
Risk Factors, p.50 — competition spans registrars, hosts, site builders, commerce, payments and email; management expects it to intensify.
The market for our products and services is highly competitive, and we expect this competition to continue in the future as existing and new competitors introduce new solutions or enhance existing solutions. […] Our competitors include providers of domain registration services, web-hosting solutions, website creation and management solutions, e-commerce enablement providers, payment facilitation providers, cloud computing service and online security providers, alternative web presence and marketing solutions providers and providers of productivity tools such as business-class email.
p. 50 · Read in context →
The relevant domain name registry and ICANN impose a charge upon each registrar for the administration of each domain name registration. If these fees increase, it would have a significant impact upon our operating results. — p. 81 · Read the full section →
GoDaddy has no control over the VeriSign/ICANN fees embedded in every .com; wholesale price hikes must be passed to customers or absorbed.
Risk Factors, p.81 — registry fees (e.g., VeriSign's .com) can rise at GoDaddy's expense; 'we have no control over ICANN, VeriSign.'
Each registry typically imposes a fee in association with the registration of a domain name. […] In addition, VeriSign, which operates the .com and .net gTLDs under registry agreements with ICANN and, with respect to the .com gTLD, a Cooperative Agreement with the U.S. Department of Commerce, has previously been given the right to annually increase prices, subject to certain limitations, and has done so in recent years […] If fees continue to increase, costs to our customers could become higher, which could have an adverse impact on our results of operations. We have no control over ICANN, VeriSign or other domain name registries and cannot predict their future fee structures.
p. 81 · Read in context →
GoDaddy Payments' risk management efforts may not be effective, and we could be exposed to substantial losses and liability which could substantially harm our business. — p. 96 · Read the full section →
The commerce growth bet carries settlement risk: as payment facilitator, GoDaddy eats fraud losses on funds it settles and can't recover.
Risk Factors, p.96 — loss exposure scales with seller size as GoDaddy settles transactions it may be unable to recover.
GoDaddy Payments offers payment processing and other payments products and services to our customers. We have programs to vet and monitor these customers, their GoDaddy Payments' accounts, and the transactions we process for them as part of our risk management efforts, but such programs require continuous improvement and may not be effective in detecting and preventing fraud and illegitimate transactions. When GoDaddy Payments' payments services are used to process illegitimate transactions, and we settle those funds to customers and are unable to recover them, we suffer losses and liability. As a greater number of sellers, including customers with larger sale volumes, use GoDaddy Payments' services, our exposure to material losses from a single seller, or from a small number of sellers, will increase.
p. 96 · Read in context →
Item 7. Management's Discussion and Analysis — Overview — p. 113 · Read the full section →
Where management explains the model — a durable, recurring-subscription business with ~85% retention — and shows the FY2025 results.
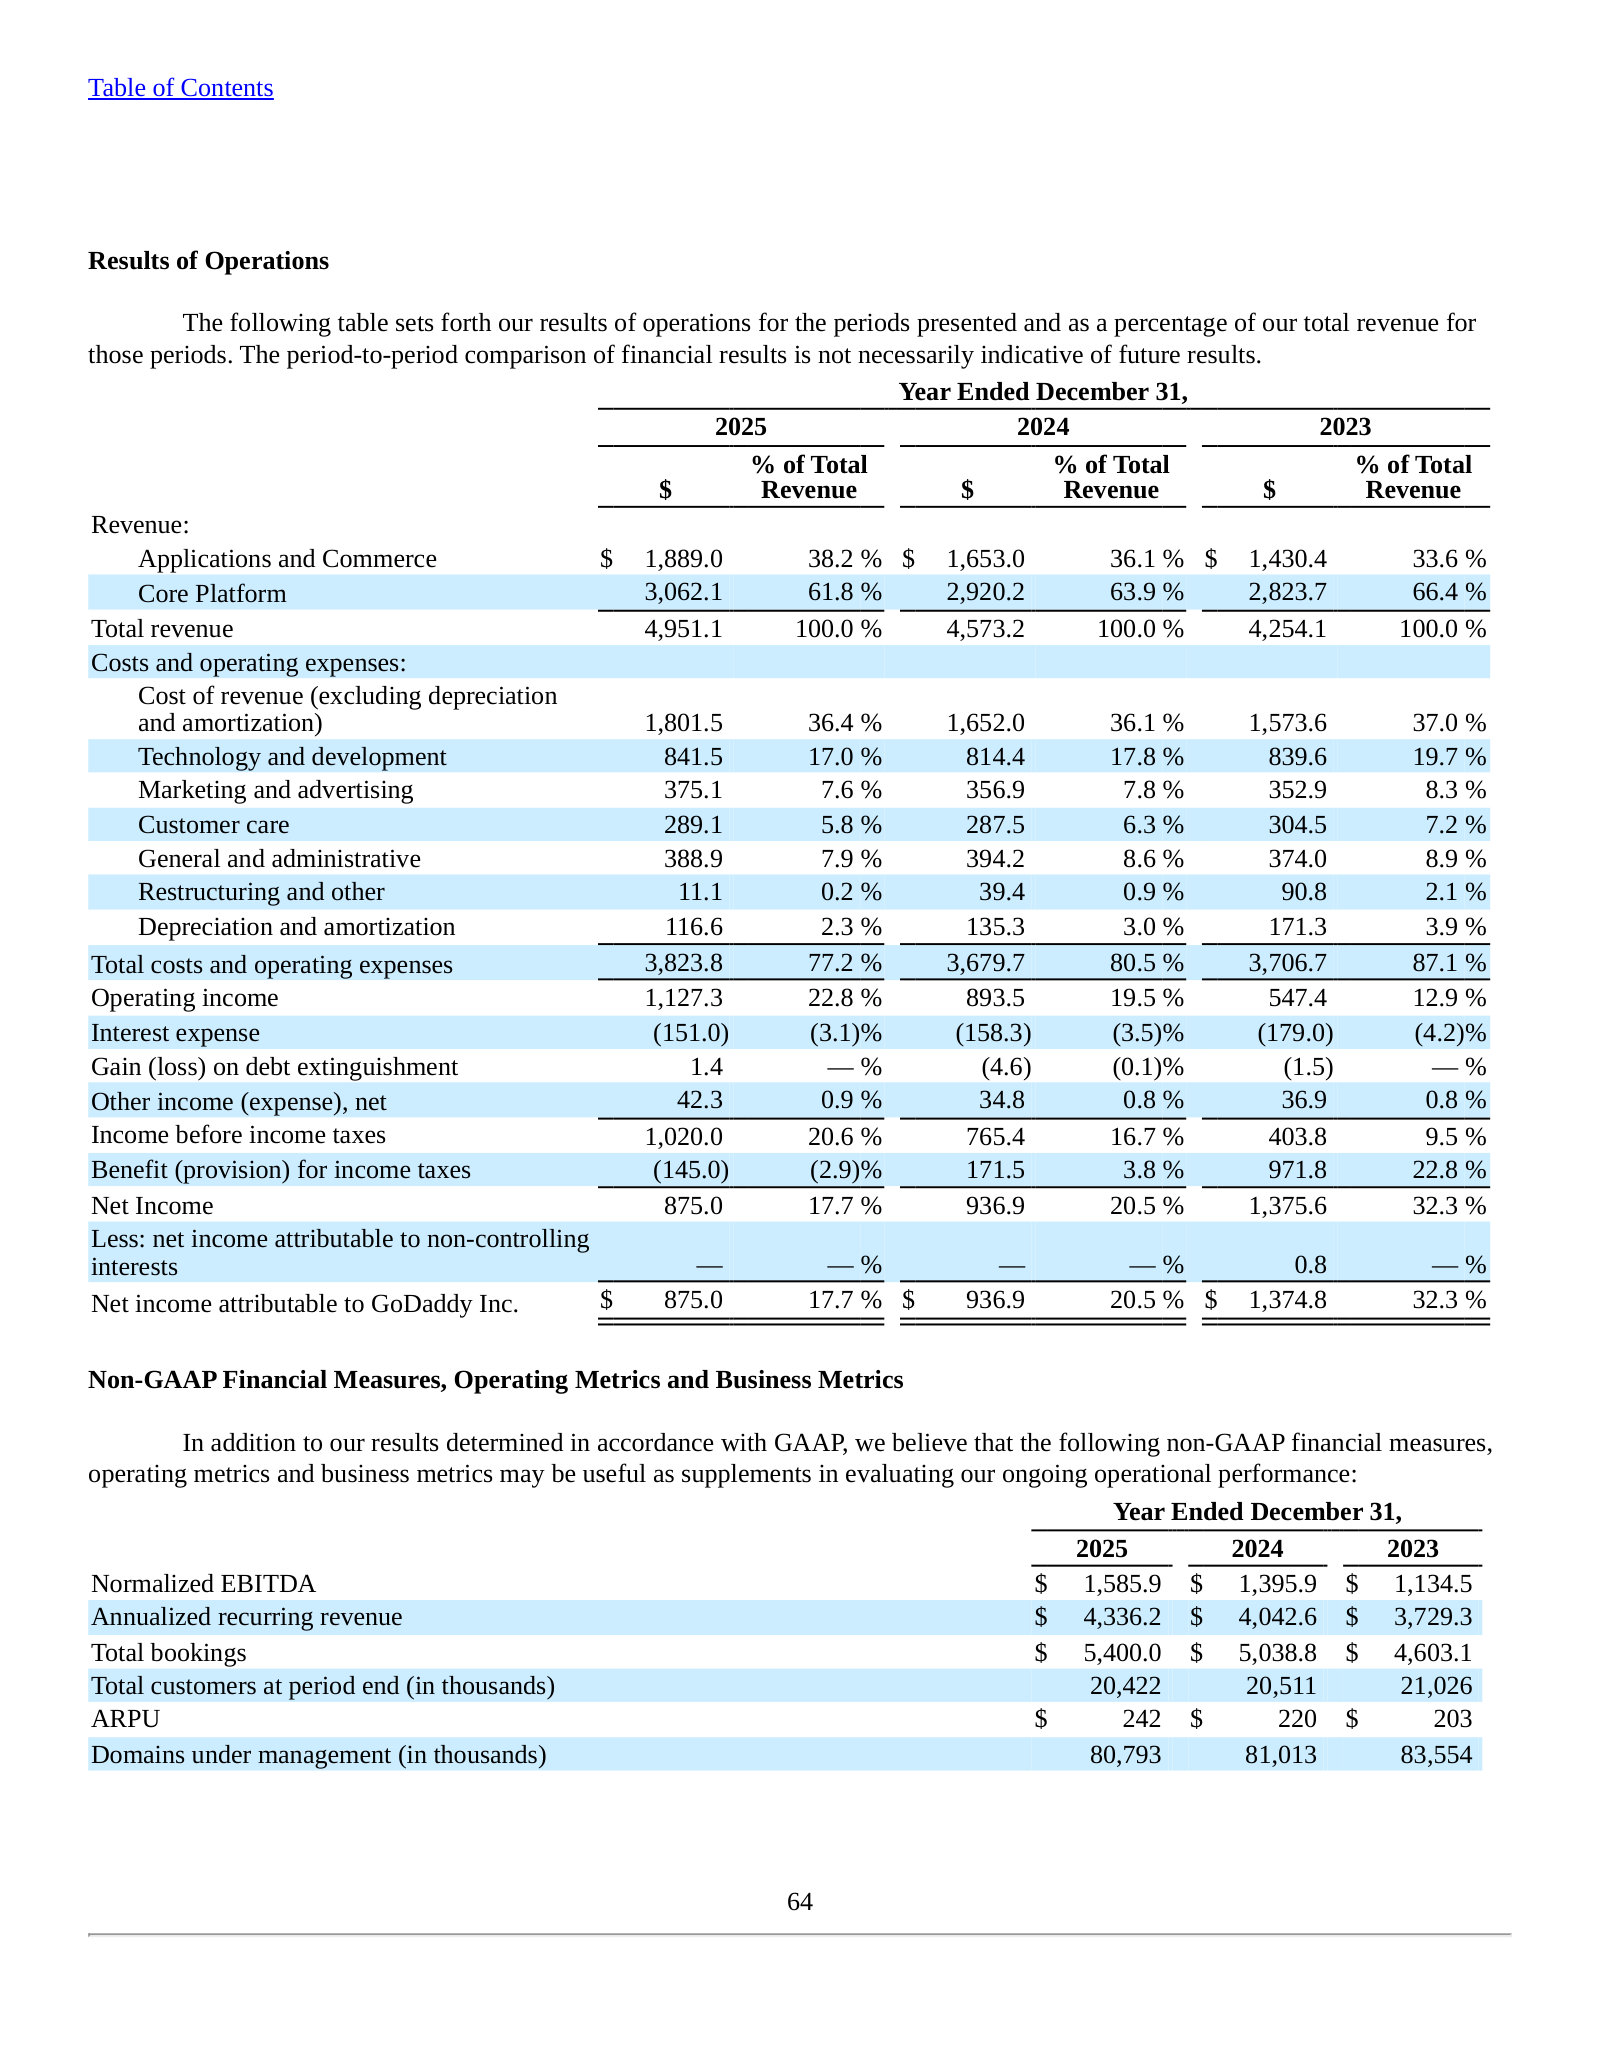
MD&A Overview, p.114 — the recurring engine: ~85% retention five years, ~90% past three years, >89% of revenue from prior-year customers.
Strong customer retention continues to drive our business. We aim to attract high-intent customers that attach more at the outset of our relationship and over time. […] we know through our long history and vast amount of data that customers with a greater number of products with us retain at higher rates and produce higher lifetime value. In each of the five years ended December 31, 2025, our customer retention rate was approximately 85% […] In addition, the retention rate for our customers who had been with us for over three years as of December 31, 2025 was approximately 90%. Greater than 89% of our total revenue for the year ended December 31, 2025 was generated by customers who were also customers in the prior year.
p. 114 · Read in context →
Item 7. MD&A — Segment Results of Operations — p. 125 · Read the full section →
The segment split that matters: A&C (~38% of revenue) is the faster, higher-margin engine (+14% / 45% EBITDA) versus Core (+5% / 33%).
MD&A Segment Results, p.125 — the two segments GoDaddy manages by, measured on revenue and Segment EBITDA.
Our two operating segments, A&C and Core, reflect the way we manage and evaluate the performance of our business. Our chief operating decision maker evaluates segment performance based upon several factors, of which the primary financial measures are revenue and Segment EBITDA, our segment measure of profitability.
p. 125 · Read in context →
Item 7. Critical Accounting Policies and Estimates — Revenue Recognition — p. 130 · Read the full section →
The policy that defines the model: domain fees booked ratably over the term (deferred revenue), plus the principal-vs-agent gross/net test.
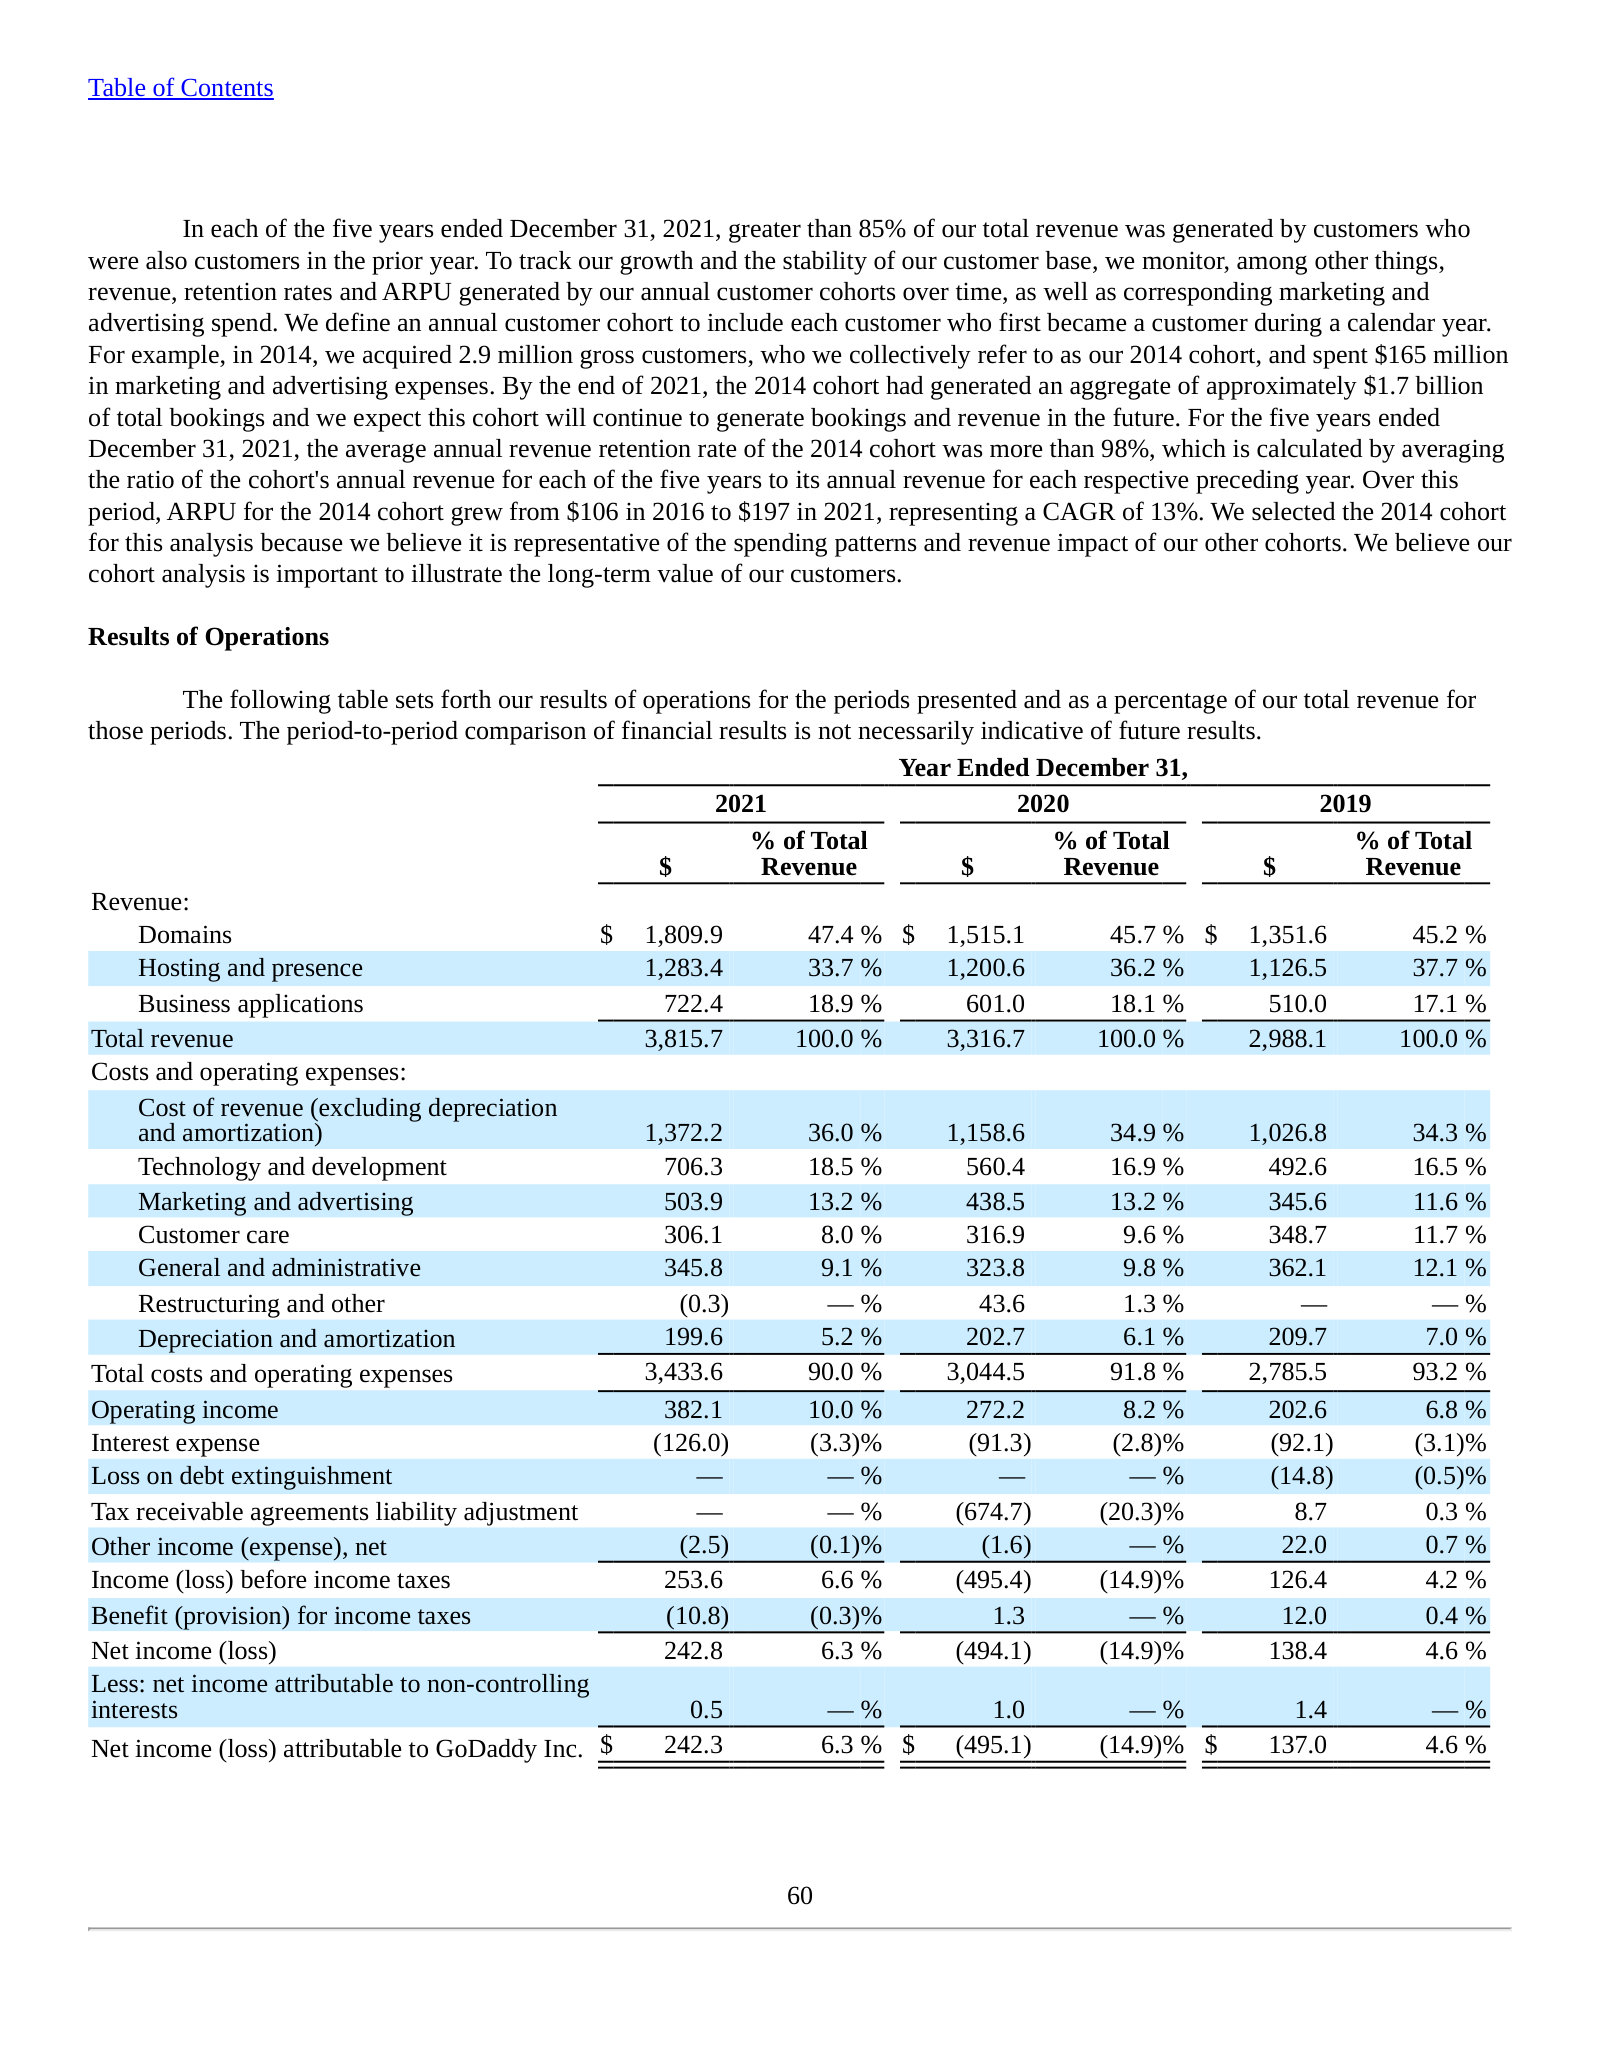
Annual Report on Form 10-K — FY2021 (year ended Dec 31, 2021)
Featured for one section — how management redefined a single segment of three product lines into today's two segments. · Open the full document →
Item 7. MD&A — Results of Operations (revenue by product line) — p. 103 · Read the full section →
The pre-2022 view: one segment split into Domains, Hosting & presence and Business applications — before the A&C/Core redefinition.
More annual reports
Annual Report on Form 10-K — FY2024 (year ended Dec 31, 2024) · 197 pages · Prior-year 10-K; the immediate baseline for the FY2025 results and risk-factor comparison. · Open →
Annual Report on Form 10-K — FY2023 (year ended Dec 31, 2023) · 224 pages · FY2023 10-K, the first full year reporting under the A&C and Core two-segment structure. · Open →
Annual Report on Form 10-K — FY2022 (year ended Dec 31, 2022) · 211 pages · FY2022 10-K, the year GoDaddy transitioned to its Applications & Commerce and Core Platform segments. · Open →
Competitors describe GoDaddy Inc.'s market in their own filings and calls. These verified passages and visual pages show where their strategies meet, using source documents preserved in Sources.
Wix.com Ltd. (WIX)
Wix is GoDaddy's closest website-builder and online-presence rival for the same small-business and entrepreneur customer, and its 10-K names GoDaddy directly as a competitor in web creation.
Wix's 10-K competition section names GoDaddy directly — grouping it with large domain-registration and hosting companies whose website-building tools overlap Wix's own — and flags generative-AI website builders as an emerging overlap.
Additionally, several large service companies that primarily offer domain registration and hosting services, such as GoDaddy, provide the ability for a business owner to build a website using their tools or have one built by their workforce. Moreover, newly emerging technologies that utilize AI may also offer services that overlap with certain solutions we offer, including the emergence of generative AI website builders.
p. 106 · Read in context →
Wix's stated scale on the shared SMB web-presence market: roughly 282.4 million registered users who began building a website with it, and about 6.2 million paid premium subscriptions at year-end 2024.
As of December 31, 2024, we empower approximately 282.4 million registered users worldwide who began the website building process with us. […] as of December 31, 2024, we had approximately 6.2 million premium subscriptions.
p. 84 · Read in context →
Wix's account of its AI Website Builder, an AI-chat-driven site generator — the product category where it competes with GoDaddy's AI-assisted site creation.
These tools include our AI Website Builder, a pioneer website generator that creates a ready-to-publish website integrated with relevant business applications, from a short conversational AI chat with users
p. 85 · Read in context →
IONOS Group SE (IOS)
IONOS is essentially GoDaddy's European analog — a full-stack domains, web-hosting, website-building and cloud provider selling the same land-and-expand bundle to small and medium-sized businesses.
IONOS's stated view of the SMB digitalization funnel — starting at domain and web hosting, then expanding into website, e-commerce, email and cloud — the same land-and-expand path GoDaddy runs with its SMB base.
This begins with the entry point of domain and web hosting and then, over time, leads to demand for additional services as the business grows […] the continuous expansion of the website, additional e-commerce solutions, and office and e-mail offerings. Eventually, other cloud-oriented services such as storage, backup, and security services are added.
p. 9 · Read in context →
IONOS's reported customer base of 6.63 million at the end of fiscal 2025, after adding roughly 307,000 net customers during the year.
Overall, the number of customers increased by approximately 307,000 in fiscal year 2025, bringing the total to 6.63 million customers.
p. 19 · Read in context →
IONOS's self-positioning as one of Europe's leading SMB digital-transformation partners, claiming a strong web-hosting and cloud market position across Europe and North America.
As one of Europe's leading digital transformation partners for small and medium-sized businesses, IONOS has established a strong market position in the web hosting and cloud sectors in Europe and North America.
p. 53 · Read in context →
Shopify Inc. (SHOP)
Shopify is the leading commerce platform and the principal rival to GoDaddy's fast-growing Applications & Commerce segment, competing for the same aspiring entrepreneurs building and selling online.
Shopify's stated pace of new-entrepreneur formation — a first sale every 26 seconds — framed by its President as growing the total market rather than taking share, targeting the same aspiring entrepreneurs GoDaddy pursues.
Harley Finkelstein (President): Every 26 seconds, a new entrepreneur makes their first sale on Shopify. […] That is TAM expansion at its best. And any of those merchants could easily become one of the world's biggest brands in a decade or less.
p. 6 · Read in context →
Shopify's reported scale — millions of merchants across more than 175 countries, 44% of them in the United States — the merchant base its commerce platform brings against GoDaddy's.
As of December 31, 2025, we had millions of merchants from more than 175 countries using our platform, geographically dispersed as follows: 44% in the United States, 31% in Europe, the Middle East and Africa, 16% in Asia Pacific, Australia and China, 5% in Canada and 5% in Latin America.
p. 7 · Read in context →
Shopify's description of its multi-channel commerce platform spanning online storefronts, physical retail, social and AI surfaces — the online-store and selling tools that overlap GoDaddy's Applications & Commerce products.
Shopify's business is designed to empower our merchants by offering a comprehensive, multi-channel commerce platform that supports their business as it grows. As owners and operators, merchants set their course, while Shopify offers them the tools to seamlessly manage, market and sell their products across various sales channels, including online storefronts, physical retail spaces, AI platforms, social media and more.
p. 7 · Read in context →
Tucows Inc. (TCX)
Tucows is a direct competitor in GoDaddy's core domains business — a top wholesale and retail registrar and domain-aftermarket operator — offering an outside read on domain-industry volumes and channel structure.
Tucows' reported 21.5 million domains under management across its OpenSRS, Enom, EPAG and Ascio registrars — and a 12.3% year-over-year decline — in a domains market GoDaddy leads.
Together the OpenSRS, Enom, EPAG and Ascio Domain Services manage 21.5 million domain names under the Tucows, Enom, EPAG and Ascio ICANN registrar accreditations and for other registrars under their own accreditations. Domains under management has decreased by 3.0 million, or 12.3%, since December 31, 2024.
p. 7 · Read in context →
Tucows' description of its wholesale distribution model — a network of more than 32,000 resellers in roughly 200 countries — a channel-led approach distinct from GoDaddy's retail-direct domains business.
Our primary distribution channel is a global network of more than 32,000 resellers that operate in approximately 200 countries and who typically provide their customers, the end-users of Internet-based services, with solutions for establishing and maintaining an online presence.
p. 7 · Read in context →
Tucows' self-positioning in the wholesale domain-registration and email markets, citing its registrar brands and its status among the first group of ICANN-accredited registrars in 1999.
We believe that we are well positioned in the wholesale domain registration and email markets due in part to our highly-recognized "Tucows", "OpenSRS", "Ascio" and "Enom" brands and the respect they confer on us as a defender of end-user rights and reseller-friendly approaches to doing business. We were among the first group of 34 registrars to be accredited by ICANN in 1999, and we remain active in Internet governance issues.
p. 8 · Read in context →
GMO Internet Group, Inc. (9449)
GMO Internet is one of the world's largest domain registrars and a major web-hosting provider, competing with GoDaddy's domains and hosting core — and, like GoDaddy, selling a one-stop SMB bundle of domains, servers, commerce and payments.
GMO Internet's stated positioning as Japan's number-one internet infrastructure and security provider, citing 8,000 partners and over 17 million customer subscriptions across its domain, hosting, payment and security businesses.
Masatoshi Kumagai (Founder, Chairman & Group CEO): Now we have 8,000 partners, providing Japan's number one infrastructure and security, and a very large number of customers with over 17 million subscriptions.
p. 13 · Read in context →
GMO's account of its internet-infrastructure segment — with cloud computing and rental servers among the drivers of a tenth consecutive year of record profit — the hosting business that overlaps GoDaddy's.
Masashi Yasuda (Director, EVP & Group CFO): Here are the full-year results of the infrastructure business. On the strength of its revenue model of bedrock stock earnings, the Company achieved its highest performance for the 10th consecutive fiscal years. In FY2025, cloud computing, rental servers, and settlement services, centered on GPU Cloud, performed well.
p. 68 · Read in context →
BigCommerce Holdings, Inc. (BIGC)
BigCommerce is a SaaS commerce platform competing for SMB online stores, though it has pivoted upmarket toward mid-market and enterprise B2B — placing it at the edge of GoDaddy's SMB commerce turf.
BigCommerce's description of its product portfolio — including the Makeswift site builder — and a dedicated Small Business offering group, the SMB-facing commerce and site-building tools that overlap GoDaddy's.
Travis Hess (CEO): We have three owned products in our portfolio today: our flagship commerce platform, BigCommerce, our AI-based product data feed management platform, Feedonomics, and our brand and commerce site builder and visual editor, Makeswift. […] We have integrated all three products both operationally and commercially and have organized the teams around three offering groups, B2C, B2B, and Small Business.
p. 2 · Read in context →
BigCommerce's CEO maps the SMB e-commerce competitive set — naming WooCommerce, Shopify and Magento as the platforms merchants migrate between — the platform market GoDaddy's commerce products also sit in.
Brent Bellm (CEO): I would say at the upper end, Custom and Magento followed by Shopify have been the biggest migrations over time. At the SMB level, it's a wide range. It's WooCommerce, it's Shopify, it's Magento as well.
p. 10 · Read in context →
More peer documents
Wix.com — Q1 FY2026 earnings call — Q1 FY2026 · 26 pages · Wix's push into AI-driven creation — the Base44 AI app-building acquisition and explicit market-share and TAM-expansion goals for web creation. · Open →
Wix.com — FY2023 annual report (Form 20-F) — FY2023 · 324 pages · The prior-year competition section that also names GoDaddy, showing the head-to-head framing is persistent, not a one-off. · Open →
Shopify — Q1 FY2026 earnings call — Q1 FY2026 · 38 pages · Shopify Payments at 67% GMV penetration and Shop Pay growth — the merchant-payments layer that competes with GoDaddy's commerce and payments. · Open →
Shopify — FY2024 annual report — FY2024 · 198 pages · Fuller merchant-base and competition discussion for the year-over-year trendline behind the FY2025 scale figures. · Open →
Tucows — FY2024 annual report (Form 10-K) — FY2024 · 180 pages · Prior-year domains-under-management base (before the FY2025 decline), useful for sizing the domain-industry contraction GoDaddy is navigating. · Open →
GMO Internet Group — FY2025 annual report (Japanese) — FY2025 · 244 pages · Japanese-language segment detail on GMO's infrastructure business — 14.24 million managed domains, ~44,000 hosting contracts, and claimed #1 domestic share in domains, servers, commerce and payments. · Open →
BigCommerce — Q1 FY2025 earnings call — Q1 FY2025 · 15 pages · Quantifies BigCommerce's split — 5,825 enterprise accounts alongside tens of thousands of small-business accounts and ~$351M ARR — showing how much SMB base overlaps GoDaddy. · Open →
Tucows — Q1 FY2026 earnings call — Q1 FY2026 · 3 pages · Latest management commentary on the domains business and aftermarket/expiry-auction dynamics that GoDaddy also competes in. · Open →
GoDaddy: The Business and the Setup
GoDaddy is the world's largest domain-name registrar and a subscription platform for small-business web presence: about 20.4 million customers, roughly 81 million domains under management, and $4.95 billion of revenue in 2025. It has grown free cash flow every year for a decade, to $1.6 billion, and used it to shrink the share count. The stock has since fallen about 58% from its January 2025 high while that cash flow kept rising — a widening gap between the share price and the cash the business produces.
What GoDaddy does
GoDaddy sells the plumbing of being online. An entrepreneur registers a domain name, points it at a website, adds email, payments and marketing tools, and pays GoDaddy a recurring subscription for each piece. The company describes itself as a global leader serving entrepreneurs as a "one-stop shop," and reports about 20.4 million customers as of December 31, 2025 [1].
The foundation is domains. GoDaddy is the largest domain registrar in the world, with roughly 81 million domains under management at the end of 2025 — about 21% of the roughly 387 million domains registered worldwide — and approximately 94% of its customers hold a domain bought from GoDaddy [2]. The domain is the entry point; the higher-value products — website building, commerce, payments, email and security — are sold on top of that relationship.
The business reports in two segments. Core Platform ($3.06 billion in 2025) is domains plus hosting and security. Applications & Commerce ($1.89 billion) is the software layer: website builders, GoDaddy Payments, and resold productivity tools such as Microsoft 365 [3]. Within Core, domains alone generated $2.31 billion [4]. Applications & Commerce is the faster-growing, higher-margin end and the segment management is pushing hardest.
Source: FY2025 Annual Report (Form 10-K), segment and disaggregated-revenue disclosures [5] [6].
The revenue is overwhelmingly recurring and paid in advance. Customers typically pay at the time of sale for subscription terms that can run from one month to ten years, and GoDaddy recognizes that cash as revenue ratably over the term. The result is a large customer-funded balance: $3.32 billion of deferred revenue at year-end 2025 — about eight months of revenue booked but not yet recognized [7]. That float is why the business converts profit to cash so heavily, and why a soft quarter is slow to show up in reported revenue.
The scale, in numbers
Customers (millions)
Revenue per Customer ($)
Domains Managed (millions)
Annualized Recurring Revenue ($M)
Source: FY2025 Annual Report (Form 10-K), MD&A Key Performance Indicators [8].
The shape of growth has shifted from adding customers to earning more from each one. The customer count is roughly flat — 20.4 million, down slightly from 21.0 million in 2023 — while average revenue per customer has climbed to $242 and annualized recurring revenue reached $4.34 billion on total bookings of $5.4 billion [9]. Growth now comes from pricing, bundling and attaching commerce and software to an existing base, not from a rising headcount of customers. About two-thirds of revenue is generated in the United States, one-third internationally.
In 2025 that produced revenue of $4.95 billion, up 8.3%, operating income of $1.13 billion (a 22.8% operating margin) and net income of $875 million, or $6.22 in diluted earnings per share [10].
A decade of rising cash flow
The reason this company is worth studying for a cash-flow-focused investor is the record below. Revenue has roughly tripled since 2016, but the more striking series is free cash flow, which has risen in every single year of the decade — through a pandemic, a rate cycle, and a leadership change — from $325 million in 2016 to $1.58 billion in 2025.
Source: derived from reported financials, FY2016–FY2025 (Consolidated Statements of Cash Flows) [11].
Two features stand out. First, the gap between free cash flow and net income runs the "wrong" way for a skeptic's instinct: free cash flow of $1.58 billion in 2025 exceeded net income of $875 million, because the deferred-revenue float and low capital intensity mean cash arrives ahead of accounting profit [12]. Second, capital intensity is minimal: capital expenditure was $23.9 million in 2025, under 0.5% of revenue [13]. This is a business that grows without needing to reinvest much cash.
One honest qualifier belongs here at the outset: reported free cash flow does not charge for stock-based compensation, which was $318 million in 2025 [14]. Deducting it would lower the true owner's cash yield by roughly a fifth. The consistency of the cash flow is real; its exact level deserves the scrutiny a later chapter can give it.
What management does with the cash
Because the business needs so little reinvestment and pays no dividend, nearly all of the cash goes to buying back stock. GoDaddy repurchased $1.6 billion of its shares in 2025 and has bought back roughly $5.4 billion over the past five years [15]. The board's authorization was raised to a cumulative $4.0 billion through 2025 and, in April 2025, extended by a further $3.0 billion through 2027, with $2.17 billion still available at year-end [16].
Source: Consolidated Statements of Cash Flows, FY2021–FY2025 [17].
The buybacks have shrunk the count: Class A shares outstanding fell to 134.7 million at year-end 2025 from 141.2 million a year earlier [18]. There is a fair counter-point on timing, worth flagging early: much of the 2025 repurchasing was done through accelerated programs at a weighted-average price of about $176 per share [19] — roughly double today's price. Buying back stock is only value-accretive at the right price, and 2025's buying was not cheap. Whether the remaining $2.17 billion authorization is deployed better from here is a question for the reader to track.
The setup: a 58% decline against a rising business
The share price and the underlying business have moved in opposite directions. The shares peaked near $214 in January 2025 and traded around $89 in July 2026 — a decline of roughly 58%. Over the same stretch, revenue accelerated to 8.3% growth and free cash flow set a fresh record [20]. The market cut GoDaddy's equity value by about 60% while its free cash flow rose roughly a quarter and 2026 free cash flow is guided higher still, compressing the multiple from about 25 times free cash flow to under 8 — a re-rating of the price, not a downgrade of the cash.
Source: market price data, monthly closes January 2024–July 2026 (as reported).
At about $89 on roughly 140.6 million diluted shares, GoDaddy is valued near $12.5 billion of equity, or about $15.2 billion of enterprise value after $2.7 billion of net debt. Against $1.58 billion of reported free cash flow, that is a free-cash-flow yield of roughly 12.6% on the equity — closer to 10% measured against enterprise value, and lower again once stock-based compensation is charged.
Share Price ($)
Equity Value ($B)
FCF Yield (on equity)
Net Debt ($B)
Source: derived from market price data (July 2026) and FY2025 Annual Report balance sheet and cash-flow statement [21] [22].
The balance sheet carries $3.78 billion of debt against $1.08 billion of cash, so net debt is about $2.7 billion — roughly 1.7 times a single year of free cash flow [23]. That is modest leverage for a business this cash-generative, though not the net-cash position a conservative screen prefers. The $3.32 billion of deferred revenue is a customer-funded obligation to deliver service, not borrowed money, and the company does not count it as debt — a distinction that matters to how the balance sheet is read, and one a later chapter should test directly.
The investment question
The pieces above frame the question the rest of this report sets out to weigh:
Can GoDaddy's domain-and-web-presence franchise keep compounding the roughly $1.6 billion of free cash flow it now produces — so that a decade out that cash flow is reliably higher, not lower — and is that durability being priced, after a 58% decline, at a double-digit free-cash-flow yield?
Both halves are contestable. The bull case is a near-monopoly registrar with a customer-funded float, a decade of unbroken cash growth, and a price that has halved while the fundamentals improved — the kind of gap between market value and cash-flow value that rewards patience. The bear case is that the same halving reflects a real threat: artificial-intelligence tools that let anyone spin up a website and a name in seconds may erode the very attach-and-upsell engine that lifts revenue per customer, and management's own filings now frame the company's future around an "agentic" internet it is racing to stay ahead of [24]. Whether the moat is durable enough to make year-ten cash flow a safe bet, and whether the current price pays for that durability with margin to spare, is what the rest of this report sets out to weigh.
Cash Quality
GoDaddy's $1.58 billion of free cash flow is real cash, not an accounting artifact: it arrives ahead of accounting profit, capital spending is negligible, and there are no working-capital tricks propping it up. Two honest charges change the picture, though. Stock compensation is a genuine cost the headline number ignores, and the company is paying almost no cash tax because of a shield that is running down. Charge both and the owner-cash yield falls from roughly 12.6% toward 7% to 8.5%. The balance sheet holds no tangible equity; the asset is the recurring cash, not the assets on the page.
Free Cash Flow FY2025 ($M)
Cash Tax Rate FY2025
Stock Comp FY2025 ($M)
Tangible Common Equity ($M)
Sources: FY2025 10-K, Consolidated Statements of Cash Flows [1]; Consolidated Balance Sheets [2]; Cash Taxes disclosure [3].
From profit to cash
The starting point is that GoDaddy's cash generation is more stable than its reported profit. Net income has swung from a $495 million loss (FY2020) to $1.37 billion (FY2023) and back to $875 million (FY2025); operating cash flow, over the same span, rose in a straight line from $765 million to $1.60 billion [4]. For a subscription business collected in advance, cash is the cleaner signal, and it is the signal the investment case in Domains and Cash Flow rests on.
Source: FY2025 10-K, Consolidated Statements of Cash Flows (FY2023–25) and reported financials (FY2020–22) [5].
Net income sat above free cash flow in only one year, FY2023, and that gap has a specific non-recurring cause. That year's profit was lifted by a $993.2 million non-cash deferred-tax benefit, booked when GoDaddy released most of the valuation allowance on its U.S. deferred tax assets [6] [7]. Strip that one entry out and the decade of cash generation is monotonic while reported earnings are not. The gap between the two is explained by three recurring items — depreciation and amortization, stock compensation, and the deferred-revenue float — and by the tax line.
The two charges a skeptic makes
Reported free cash flow adds back $317.8 million of stock-based compensation and does not treat it as a cost [8]. That is a real economic charge — equity handed to employees is value transferred from shareholders — running at about 6.4% of revenue. GoDaddy has more than offset the dilution with buybacks (Class A shares fell from 141.2 million to 134.7 million in FY2025) [9], but the buybacks cost cash the free-cash-flow line already counts as available. Charging stock comp is the first adjustment.
The second is tax. GoDaddy paid $16.5 million of cash income tax in FY2025 on $1,020.0 million of pretax income — an effective cash rate near 1.6%, against a book tax expense of $145.0 million and a 21% federal statutory rate that would imply roughly $214 million [10] [11]. Cash tax has been trivial for years — $10.6 million (FY2023) and $19.1 million (FY2024) [12]. That is a benefit, not a permanent feature.
Sources: FY2025 10-K, Cash Taxes disclosure [13]; statutory figures derived from pretax income, Consolidated Statements of Operations [14].
The shield behind the low cash tax is a net deferred tax asset of $1,047.9 million, dominated by $571.2 million of net operating losses and $243.0 million of tax credits, and it is depleting: it fell $113.4 million in FY2025 alone [15]. Gross federal net operating losses of $2,429.7 million remain [16], so cash taxes stay suppressed for several more years, but as the carryforwards are used up cash tax normalizes toward book — an eventual drag on free cash flow of roughly $150 million to $200 million a year at current profit levels.
Putting both charges through the arithmetic reframes the yield. Against the roughly $12.5 billion equity value and $15.2 billion enterprise value established in Domains and Cash Flow, the headline free cash flow is a 12.6% equity yield. Charge stock comp and it is about 10.1%; normalize cash tax as well and it is about 8.5% on equity, near 7.0% on enterprise value.
Source: derived from FY2025 reported cash flow, stock compensation, and cash-tax disclosures; yields against the equity and enterprise value in Domains and Cash Flow [17].
Source: derived from reported financials, FY2025 10-K [18]; the normalized-tax line is illustrative, applying a ~20% cash rate to pretax income.
GoDaddy's headline 12.6% free-cash-flow yield shrinks to about 8.5% once stock comp and a normalized cash tax are charged against the $16.5 million of cash income tax it actually paid on $1,020 million of pretax profit, and at that burdened level the price implies owner cash flow grows only about -1% to +2% forever — a yield already priced for terminal stagnation rather than the clean double-digit bargain the headline suggests. The near-term counter runs the other way: 2026 free cash flow guided to roughly $1.8 billion is about a 14% forward yield, so the business is not yet in terminal decline.
The float, and a balance sheet with no equity
What a skeptic will not find is manufactured cash. GoDaddy collects subscriptions in advance, so it carries $3,319.1 million of deferred revenue — $2,384.2 million current and $934.9 million longer-dated — which is customer money held before the service is delivered [19] [20]. That float grew by $206.8 million in FY2025 and contributed to operating cash flow [21] — a real tailwind, but a contained one at about 13% of the year's operating cash; the bulk of the cash is generated by the business, not by the float expanding. The float is a debt of service, not of money: it is discharged by delivering hosting and domains at near-zero marginal cost, which is why the company does not — and should not — count it as debt in its net-debt math.
The rest of the working capital is clean. Receivables are $83.1 million against $4.95 billion of revenue — roughly six days of sales, and lower than a year earlier — because customers pay up front; there is no inventory to age [22]. Accounts payable fell, from $148.1 million (FY2023) to $67.5 million, and were a use of cash in the year, not a source [23] [24]. Stretching suppliers to flatter cash flow is a common late-cycle tell; the opposite is happening here.
The balance sheet itself will not anchor a valuation. Total stockholders' equity is $215.1 million, but that sits on top of $3,633.3 million of goodwill and $986.3 million of other intangibles, leaving tangible common equity of roughly negative $4.4 billion, and an accumulated deficit of $2,789.4 million after a decade of buybacks and past losses [25] [26]. Price-to-book is not a meaningful lens for this company; what is being bought is a recurring-cash annuity, and the earlier chapters price it as one.
Net debt sits at about $2.70 billion — total borrowings of $3,780.3 million less $1,080.9 million of cash — or roughly 1.7 times free cash flow, and closer to 2.1 times once cash flow is charged for stock comp [27]. The maturities are termed out and laddered, with the nearest wall a $600 million note due December 2027, then term loans and notes falling in 2029 and 2031 [28]. Cash interest ran $139.5 million, under 9% of operating cash flow [29]. No single year's cash flow is at the mercy of a refinancing.
Source: FY2025 10-K, Note 9 Long-Term Debt [30].
What would change the read
The evidence points to genuine cash quality: operating cash flow has risen every year for a decade, capital intensity is negligible, the deferred-revenue float is a structural feature rather than a trick, and the working capital shows no signs of being managed for appearances. The main qualification is presentation, not integrity: the headline yield overstates sustainable owner cash because it ignores a real 6.4%-of-revenue stock-comp charge and rests on a cash-tax rate that is temporary. What would change the read in either direction is observable: cash taxes climbing toward the high-teens as the carryforwards deplete, or stock comp staying near current levels, would pull the sustainable yield toward 7%; a durable float and continued sub-1%-of-revenue capital spending would hold it nearer the top of the 7%-to-8.5% band. The number to watch is cash tax paid, disclosed each year in the tax note.
Moat and Durability
Every dollar of GoDaddy's two-year revenue growth came from raising revenue-per-customer from $203 to $242 on a customer and domain base each shrinking about 3%, and that lift is concentrated in one higher-margin segment — Applications & Commerce, at a 45.4% segment-EBITDA margin and ~46% of segment EBITDA on ~38% of revenue — all resting on the domain that anchors 94% of customers, the same product GoDaddy's 10-K warns AI could make unnecessary [1] [2] [3] [4] [5]. Revenue grew 16.4% from 2023 to 2025, and all of it came from that pricing-and-mix lever: total customers fell 2.9% and domains under management 3.3% over the same span, while Applications and Commerce earned a 45.4% segment-EBITDA margin against the Core segment's 33.0% [6] [7] [8].
The offsetting facts sit in the same disclosures. The unit decline is substantially deliberate pruning — eliminated discounts, hosting divestitures and retired low-value products — retention held near 85% across the five years through 2025, and both the customer count and domains under management turned up in the first quarter of 2026, by about 13,000 and 598,000 respectively [9] [10] [11]. Whether year-ten cash flow is higher therefore turns on how far the per-customer figure can keep traveling; the deliberate-pruning case is developed in Pruning the Base.
The moat, measured
A moat that matters shows up in retention, and GoDaddy's does. Its blended customer retention rate has sat at roughly 85% in each of the five years through 2025 (about 84% in 2024, held down by deliberate divestitures and product end-of-life), and it climbs to roughly 90% once a customer is past three years with the company. More than 89% of 2025 revenue came from prior-year customers [12].
The customer cohorts make that durability concrete. GoDaddy acquired about 5.0 million customers in 2017 for $253.2 million of marketing spend; by the end of 2025 that one cohort had generated roughly $3.0 billion of cumulative bookings, at an average annual revenue retention rate above 91% over the seven years [13]. A cohort that returns roughly twelve times its acquisition cost over eight years, while spending more each year, is the definition of a low-churn subscription franchise with real switching costs.
Retention Rate
Retention, 3+ Year Customers
Revenue From Prior-Year Customers
Share of World Domains
Source: FY2025 Annual Report (Form 10-K), MD&A and Item 1 Business [14] [15]; "over 89%" and "approximately 90%" shown at their disclosed thresholds.
The switching cost is concrete rather than contractual. A customer who leaves does not just cancel a subscription; they move the domain that is their address on the internet, the email tied to it, the website built on GoDaddy's tools, and increasingly the payments and commerce plumbing behind it. About 94% of GoDaddy customers hold a domain with the company, and the domain is the anchor the rest attaches to [16]. Scale reinforces it: roughly 81 million domains under management, about 21% of the roughly 387 million registered worldwide, the largest single position in the industry [17].
Where the growth actually comes from
The moat holds the base. It is not adding to it. Total customers slipped from 21.0 million at the end of 2023 to 20.4 million at the end of 2025, and domains under management fell from 83.6 million to 80.8 million over the same span; what rose was average revenue per user, from $203 to $242, up about 19% in two years [18]. Revenue growth is a pricing-and-mix story on a flat-to-shrinking unit base, not a customer-acquisition story.
Source: derived from reported operating metrics, FY2025 Annual Report (Form 10-K); revenue, ARPU, total customers and domains under management indexed to FY2020 [19].
This is where the durability question sharpens. The rising ARPU is healthier than a simple price hike — customers are buying more products, and multi-product customers retain at higher rates — but the mechanism concentrates in the higher-margin Applications and Commerce segment, whose economics Commerce Engine works through in detail. Raising ARPU roughly 8–10% a year on a stable base is a fine model for years, and higher lifetime spend on loyal multi-product customers is exactly what a compounder wants. But it is a narrower base to grow from than a rising customer count, and it leans on continued pricing power and attach — the very levers most exposed if the reason a customer needed GoDaddy in the first place gets easier to satisfy elsewhere.
The competitive set and the disintermediation risk
The near-in competition is fragmented and, on the evidence, contained. GoDaddy names a long roster across its markets — Newfold Digital, Namecheap, Tucows, GMO, Cloudflare and Identity Digital in domains and hosting; Wix, Squarespace, Automattic, IONOS and the hyperscalers Google, Amazon and Microsoft across presence and commerce — and describes the market as "highly fragmented and competitive" [20]. No single rival is taking the domain franchise; 21% global share has been stable, and retention has not cracked under a decade of this competition. Fragmentation, held off by scale and switching costs, is a manageable condition, not the threat that halved the stock.
The threat that matters is stated plainly in GoDaddy's own risk factors. "The widespread acceptance of any alternative system, such as mobile applications, AI-powered products and tools or closed networks, could eliminate the need to register a domain name or to establish an online presence," and as reliance on social channels and AI tools grows, "domain names, websites and online stores and marketplaces may become less prominent, and their value may decline" [21]. The company adds that it expects "more competition… from both traditional and non-traditional competitors" as products fill with AI and large language models [22]. This is the bear thesis: if an entrepreneur can stand up a presence by describing it to an AI agent — with no domain to register and no website to build — the attach-and-upsell funnel that lifts ARPU loses its starting point.
Management's answer: Airo and ANS
GoDaddy is not standing still, and it is worth weighing what it has built rather than dismissing it. Two responses stand out.
The first is monetizing AI inside its own funnel. GoDaddy Airo, its AI experience spanning domains, sites, logos, email and marketing, has moved from a generative toolset toward an agentic one, and the company has begun charging for it — Airo Plus is positioned as a direct monetization vehicle, with paywalls inside the experience [23]. This turns the AI shift from pure threat into a potential new price lever on the same base.
The second is more strategically interesting. GoDaddy has launched Agent Name Service (ANS), an open architecture that anchors AI-agent identity to the domain name system — the same DNS infrastructure its domain leadership already sits on. ANS is in production, with registered agents operational since the end of 2025, an open API for developers, and a public transparency log [24]. The logic is to convert the disintermediation risk into an extension: if AI agents need discoverable, verifiable identities to transact with one another, and that identity is anchored to domains, then a world of billions of agents could need more domain-based identity, not less. On the Q4 2025 call, management framed its edge as more than 20 million customers, decades of proprietary behavioral data, and distribution at the top of the funnel — the assets it would use to deploy agentic capabilities at scale [25].
The honest read is that this is a credible, well-positioned response, not yet a proven one. ANS is months old and unmonetized; Airo Plus revenue is early and undisclosed. Management itself notes that as AI is embedded into its solutions, "monetization trends could be affected" — an acknowledgement that the pricing mechanics could cut either way [26].
The read
The moat is genuine and measurable — narrow-to-wide on the strength of switching costs, brand and domain scale, and it has survived a decade of fragmented competition without losing share or retention. The variable the case is most sensitive to is not whether the base leaves; it is whether GoDaddy can keep lifting revenue per customer roughly 8–10% a year on a base that is no longer growing in units, at the moment AI is lowering the cost of doing without a domain and a website. The strongest fact for the durable view is that ARPU has compounded through the first three years of the generative-AI era while retention held [27]. The strongest fact against it is the company's own admission that AI-powered alternatives could eliminate the need for the domain that anchors 94% of its customers [28] [29]. What would change the read, in either direction, is the customer-count line and the ARPU line in the quarterly metrics: a base that resumes growing, or an ARPU curve that keeps bending up, argues durability; a stalling ARPU alongside a still-eroding count would say the pricing lever is nearing its limit. </content> </invoke>
Commerce Engine
GoDaddy's growth comes almost entirely from spending more per customer. This chapter locates where that spending goes: the Applications and Commerce segment, which grew 14% to $1.9 billion in 2025 at a 45% segment-EBITDA margin while the larger Core segment grew 5% [1]. Inside it sits a payments business that processed $3.4 billion of volume, up 31% [2]. The pricing lever is real and mix-accretive — though GoDaddy discloses less about it than peers do.
The moat chapter (Moat and Durability) established that GoDaddy now grows by lifting revenue per customer, not by adding customers: average revenue per user rose to $242 in 2025 from $203 in 2023 and $170 in 2020, while the customer count edged down [3]. That raises the question of what the customer is buying more of, and whether it is the kind of spending that lasts. The answer is a mix shift toward a structurally higher-margin part of the business.
The engine under the ARPU line
GoDaddy reports in two segments. Core — domain registration plus legacy hosting and security — is the bigger and older franchise. Applications and Commerce is the newer stack: website and marketing software, productivity tools (email, Microsoft 365), and commerce (online stores plus GoDaddy Payments). Over five years the two have diverged sharply. Applications and Commerce revenue more than doubled, from $926 million in 2020 to $1,889 million in 2025, a 15% annual rate; Core grew 5% a year to $3,062 million [4].
Source: FY2025 10-K, Item 7 Segment Results (FY2023–FY2025) [5]; FY2020–FY2022 per company segment disclosures, as reported.
The mix shift is the point. Applications and Commerce was 28% of revenue in 2020; it was 38% in 2025 and is the part still compounding at a double-digit rate. Within Core, the domains line grew (to $2,310 million) while the "other" line — hosting and security — actually shrank, from $869 million in 2020 to $752 million in 2025. So the blended ARPU gain is not uniform price-taking across a static product set; it is customers migrating spend toward the newer, faster-growing software and commerce layer.
Where the margin comes from
Every dollar of GoDaddy's two-year revenue growth came from raising revenue-per-customer from $203 to $242 on a customer and domain base each shrinking about 3%, and that lift is concentrated in one higher-margin segment — Applications & Commerce, at a 45.4% segment-EBITDA margin and ~46% of segment EBITDA on ~38% of revenue — all resting on the domain that anchors 94% of customers, the same product GoDaddy's 10-K warns AI could make unnecessary [6] [7] [8] [9]. Against that concentration, the base is steadier than it looks: the unit decline is substantially deliberate pruning (Pruning the Base), blended customer retention held at about 85% [10], and both the customer count and domains under management turned up in the first quarter of 2026 — about 13,000 more customers and 598,000 more domains [11].
That migration matters because Applications and Commerce is the more profitable segment, and the gap is widening. Its segment-EBITDA margin reached 45.4% in 2025, up from 41.5% in 2023; Core's margin was 33.0%, up from 28.9% [12]. A dollar of revenue shifting from Core to Applications and Commerce therefore lifts the blended margin twice over: the segment is both higher-margin and expanding its margin faster.
Source: FY2025 10-K, Item 7 Segment Results [13]; FY2020–FY2022 per company segment disclosures, as reported.
Applications and Commerce now earns nearly as much segment profit as Core — $857 million against $1,010 million — on barely more than half the revenue. That is what carried company-wide operating margin from 19.5% in 2024 to 22.8% in 2025 [14]. One caution on the figure: segment EBITDA is measured before unallocated corporate overhead, stock-based compensation, and depreciation, so 45% is a segment contribution margin, not a fully-loaded one. The fully-loaded read is the 22.8% company operating margin, and the burdened-cash read is in Cash Quality. What the segment line establishes is direction: the incremental dollar is higher-margin than the average dollar.
The payments flywheel
The fastest-moving piece inside Applications and Commerce is commerce, and specifically GoDaddy Payments — the processing business built on the 2021 Poynt acquisition. Its scale is measured by gross payments volume (GPV), the annualized dollar value of transactions run through the platform. GPV crossed $1 billion in early 2023 [15], reached $2.6 billion in 2024 [16], and $3.4 billion in 2025, up 31% [17]. It is the one line growing three to four times faster than the company.
Payments GPV, 2025 ($B)
▲ 31% YoY
Apps and Commerce Rev ($M)
Segment EBITDA Margin
Sources: 2026 Proxy Statement (GPV) [18]; FY2025 10-K, Segment Results (revenue, margin) [19].
Payments deepen the moat in a way a price increase does not. A merchant who takes card payments through GoDaddy has wired the company into daily cash flow, not just an annual renewal — a higher switching cost than a domain alone. But two limits belong in the same paragraph. GPV is a volume metric: GoDaddy earns a processing rate on it, and it does not break out payments revenue or that take rate, so the reader cannot size the profit the flywheel actually produces. And at $3.4 billion of volume it remains a small fraction of the transactions its customers run, which is either the runway or the reason the disclosure stays vague.
Benched against Wix
The natural same-model comparison is Wix — a website-builder and business-solutions platform that, like GoDaddy, sells prepaid subscriptions and layers commerce and payments on top. Wix confirms the model in its own filings: 2024 revenue of $1,760.7 million, of which Business Solutions (payments and commerce) was $495.7 million, up 21% [20]. The bench cuts two ways, and it is worth being even-handed about both.
Sources: GoDaddy — FY2025 10-K [21], 2026 Proxy [22]; Wix — FY2024 20-F [23], Q4 2025 call [24].
In GoDaddy's favor: its Applications and Commerce segment alone is roughly the size of all of Wix, and it earns far more. Wix's whole-company GAAP operating margin was 5.7% in 2024 [25]; GoDaddy's was 19.5%, rising to 22.8% in 2025. And GoDaddy's payments volume is growing about three times faster than Wix's, whose GPV rose 11% to roughly $3.7 billion against macro headwinds [26]. GoDaddy's engine is younger and accelerating; Wix's is more mature and, for now, stalling.
In Wix's favor, and to the reader's benefit, two things. Wix grows faster at the top line — mid-teens versus GoDaddy's high-single-digits — because it is still adding users, where GoDaddy's customer count is flat. And Wix tells investors something GoDaddy does not: a net revenue retention figure of 105% in 2025 [27], a clean measure of whether existing customers spend more or less over time. GoDaddy publishes gross retention (~85%) and ARPU, but no net-revenue-retention number — so a thesis that rests on per-customer expansion is being asked to trust a metric the company keeps to itself. On the available evidence the two look similar: GoDaddy's 10% ARPU gain on a roughly flat customer base implies net expansion in the same neighborhood as Wix's 105%.
What management is steering toward
Management frames the mix shift as the plan, not an accident. At its 2024 investor day GoDaddy described Applications and Commerce momentum as "a tailwind to profitability and free cash flow per share," with the segment reaching 40%-plus of revenue by 2026 (it was 38% in 2025) [28]. The medium-term "North Star" attaches numbers: 6%–8% annual revenue growth through 2026, a roughly 33% normalized-EBITDA margin in 2026, and cumulative free cash flow above $4.5 billion over 2024–2026 [29]. The 2024 scorecard came in ahead on the profitability lines — 31% normalized-EBITDA margin, ~400 bps of expansion, and 21% Applications and Commerce bookings growth [30]. The margin story, so far, is being delivered by exactly the segment this chapter isolates.
The read: the ARPU engine is higher-quality than a flat customer count first suggests. It is a mix shift into a structurally more profitable, still-double-digit-growth segment — Applications and Commerce, about 38% of revenue, which drove roughly 330 basis points of company operating-margin expansion in 2025, to 22.8% from 19.5% [31] — reinforced by a payments flywheel scaling three times faster than the company: customers buying more, not merely paying more. The strongest fact against that read is disclosure, not economics: GoDaddy withholds the net-revenue-retention and standalone-commerce figures that would let an outsider verify durability, and the headline 45% segment margin is a contribution measure, not a fully-loaded one. What would change the read is visible in the quarterly lines — Applications and Commerce growth slipping toward Core's mid-single-digits, GPV growth stalling as Wix's has, or ARPU flattening while the customer count keeps shrinking.
Pruning the Base
GoDaddy's customer count has fallen about 3% since its 2023 peak, to 20.4 million, even as revenue grew 16%. The evidence — retention near 85%, ARPU up from $203 to $242, bookings intact, and a high-spend cohort growing toward 10% of the base — points to a decline that is substantially deliberate: deep discounts cut, hosting divested, low-value products retired. The unfinished part is the net customer growth management promised for 2025, which arrived a year late.
The number that most moves the ten-year revenue case is not ARPU, which the moat chapter already traced (Moat and Durability); it is why the base underneath that ARPU is shrinking. A customer count that is falling because low-value accounts are being cleared out is a different investment than one falling because the franchise is eroding — the first strengthens the durability leg of the thesis, the second undermines it. This chapter diagnoses which one GoDaddy is.
What actually left
The base peaked at 21.0 million customers at the end of 2023 and has declined since: to 20.5 million in 2024 and 20.4 million in 2025, before ticking up 13,000 in the first quarter of 2026 [1] [2]. Over the same span ARPU rose without pause, from $203 to $242 and $246 on a trailing basis by the first quarter of 2026 [3] [4].
Source: total customers at period end, FY2023 and FY2025 Annual Reports (Form 10-K) and Q1 FY2026 Form 10-Q; on GoDaddy's current customer definition [5] [6] [7].
Two things matter about who left. Management's account is that the churn concentrated in the lowest-value tier — "primarily among one product customers, often low-cost domains" moving through their renewal cycle after product end-of-life migrations [8]. At the same time, the top of the base grew: the cohort of customers spending more than $500 a year rose to nearly 9% of the total by mid-2025 and about 10% by the first quarter of 2026, at what the company calls near-perfect retention [9] [10]. A base that loses single-product, low-dollar domain holders while adding $500-plus multi-product customers is trading down in headcount and up in value.
The case that the shrink is deliberate
The decline traces to a sequence of choices management began making in 2023 and has narrated consistently since. In 2023 it "took deliberate steps… to rationalize" a hosting portfolio that was not accretive to the model [11]. By the end of 2024 the CFO put the whole reset in one line: "This focus on quality over quantity has increased our model's resilience, profitability, and cash flow. By eliminating deep discounts, completing targeted divestitures, and migrating certain offerings, our customer base declined to 20.5 million" [12]. The work continued into 2026: the company retired another "lower-value product offering" in the first quarter, which "did not materially impact bookings" [13].
Sources: earnings-call commentary, Q4 FY2023, Q4 FY2024, Q2 FY2025 and Q1 FY2026 [14] [15] [16] [17].
Management's word is a lead, not evidence, so the account has to be tested against harder facts. Four independent lines corroborate it.
First, the framing predates the decline and sits in a document written for a regulator, not investors. In November 2022 — before the base turned down — GoDaddy told the SEC why it discloses customer count only annually: "While customer count is certainly a factor in our growth trends, it is not always a primary driver; go-to market and experimentation strategies we utilize at different periods in time may cause short-term changes in customer count that will not necessarily translate into sustained revenue growth." It added that "customers with lower-dollar contributions may be concentrated in a given quarter based on the timing of go-to-market promotions" [18]. A company that explicitly separated low-dollar accounts from durable revenue a year before shedding them is doing something it had already reasoned about, not reacting to attrition it did not foresee.
Second, the metrics that would deteriorate under genuine erosion did not. Blended retention held at roughly 85% through the decline, dipping only to about 84% in 2024 — the year of the heaviest divestitures and end-of-life work — and the customers on the integrated platform retained above 85% [19]. ARPU compounded throughout. Bookings, the leading edge of cash flow, were not materially dented by the product retirements [20]. Erosion of a franchise shows up as falling retention and softening cash collection; neither appeared.
Third, GoDaddy demonstrably retains the ability to add customers when it chooses to. Promotional offers run in late 2025 and early 2026 "generated significant gross customer adds — over 100,000 new customers from that set of promotions," and drove new domain registrations up 6% [21] [22]. The company then chose to "retire an older, lower-value product" in the same quarter, partially offsetting those adds — the CEO's words were that "these are deliberate portfolio choices" and the CFO's that the retired product had "only a slight impact on churn within that customer group" [23]. A firm that can turn a six-figure customer tap on and off is managing the count, not losing it.
Fourth, the domain base is confirming the turn. Domains under management, which fell from 83.6 million in 2023 to 80.8 million at the end of 2025, rose to 81.4 million in the first quarter of 2026 — an increase of about 600,000 in a single quarter, consistent with the promotional adds rather than with disintermediation [24] [25].
Retention Rate (5-yr)
Base Spending Over $500 (Q1'26)
Gross Adds From Promotions
Domains, Q1'26 (M)
Sources: retention and cohort commentary, Q4 FY2024, Q2 FY2025 and Q1 FY2026 calls; domains from the Q1 FY2026 Form 10-Q [26] [27] [28] [29]; "over $500" cohort shown at its disclosed ~10% level.
What the deliberate read still owes
Calling the shrink deliberate does not make it costless, and two facts keep the diagnosis honest.
The first is a promise that slipped. Management guided a return to customer growth for 2025 — first in the third quarter of 2024, "with the previously mentioned divestiture and migration efforts behind us, we expect to return to customer growth in 2025" [30], repeated at year-end 2024, and again in mid-2025 as growth "later this year" [31]. The base still ended 2025 below where it ended 2024 (20.4 million against 20.5 million); the first net addition did not land until the first quarter of 2026, and it was 13,000 [32] [33]. A return to growth guided for 2025 that arrives, barely, in 2026 fits the pattern the credibility chapter documented — cash and margin targets met, growth targets set high and delivered late or low (Promise and Delivery).
The second is that some of the churn is genuine, even if concentrated. In mid-2025 the company acknowledged it was still seeing "residual pressure from migrations as they move through their initial renewal cycles," and that this fell "primarily among one product customers, often low-cost domains" [34]. These are real customers not renewing. The defensible claim is that they were low-value and that GoDaddy chose the migrations that surfaced them — not that no one is leaving.
There is also a structural limit worth naming. Pruning is a one-time reset, not a repeatable engine: a base can be cleaned of its lowest tier once, after which the arithmetic of growth reverts to either net customer additions or continued per-user gains. GoDaddy has spent three years trading unit growth for customer quality; from here, either the count resumes rising or the case is most sensitive to the ARPU lever the moat chapter flagged.
The read
The weight of the evidence is that the customer decline is substantially deliberate — a mix of eliminated discounts, hosting divestitures and low-value product retirements that cleared the lowest-dollar tier while retention held near 85%, ARPU compounded, bookings stayed intact, and the high-spend cohort grew. The SEC correspondence, written before the decline and to a regulator, is the strongest single piece of corroboration that this was a considered strategy rather than a rationalization of erosion. The strongest fact against the benign read is the return-to-growth guidance that management set for 2025 and did not meet until 2026, which shows the "clean base flips to net growth" step is real but running late.
This recasts the durability question the report has been circling. The residual doubt about whether revenue is higher a decade out (What the Price Implies) is not, on this evidence, that customers are fleeing a disintermediated product — the base is being managed, and both the count and the domain total turned up in early 2026. It is the narrower question of whether pricing power can keep carrying a base the company has chosen to keep lean. What would change the read: sustained net customer additions through 2026 alongside continued ARPU gains would confirm the deliberate account and the return to growth; a base that resumes falling while ARPU flattens would say the pruning story was covering for erosion after all.
Capital Allocation
GoDaddy has turned itself into a near-pure buyback machine. It pays no dividend, has made essentially no acquisitions since 2022, and now routes more than 95% of free cash flow into repurchasing its own stock — shrinking the diluted share count from a 171-million peak to 141 million [1]. That converts the cash flow of the prior chapters into per-share value. On buyback quality, the case is most sensitive to price discipline, and the record is two-sided: a four-year program averaging roughly $91 a share, but its single largest year spent near the top.
From buying growth to buying shares
For most of its public life GoDaddy grew partly by acquisition. It bought Host Europe Group in 2017 (the year investing cash outflow reached $1.6 billion), the Neustar registry business and Poynt — now GoDaddy Payments — in 2020–2021, and a string of smaller assets. Business-acquisition spend ran $424.7 million in 2020 and $367.7 million in 2021 [2]. Then it stopped: business acquisitions fell to $72.5 million in 2022 and to zero in each of 2023, 2024 and 2025 [3].
The capital that once bought companies now buys stock. Repurchases climbed from $458.6 million in 2019 to $1,294.6 million in 2022 and $1,601.9 million in 2025 [4]. Cumulative repurchases since January 2022 reached about $5.1 billion by the first quarter of 2026 [5].
Source: derived from reported cash-flow statements — FY2021 10-K [6]; FY2023 10-K [7]; FY2025 10-K [8].
This is a defensible pivot. A domain-and-web-presence franchise that already earns a double-digit free-cash-flow yield on its own equity has a high bar for external deals, and management has chosen to clear that bar by buying the asset it knows best. It also removes the integration risk that inorganic growth carries. The cost is optionality: with M&A shelved, the durability of the business now rests almost entirely on the organic engine examined in Moat and Durability, not on redeployment into new lines.
The share count is genuinely coming down
The buybacks are large enough to move the count that matters. Weighted-average diluted shares fell from a peak of 171.1 million in 2021 to 140.6 million in 2025, a decline of about 18% [9][10]. Because the base keeps shrinking, per-share value builds faster than net profit over time: from 2022 to 2025 net income attributable to GoDaddy grew from $352.2 million to $875.0 million while diluted earnings per share climbed from $2.19 to $6.22 — a near-tripling against a roughly two-and-a-half-fold rise in profit, with the difference coming from the smaller share count [11][12].
Source: weighted-average diluted share counts, FY2022 10-K (2020–2022) [13] and FY2025 10-K (2023–2025) [14].
One qualifier belongs next to that number. The company frames the reduction more generously — a 31% cut in cumulative gross fully diluted shares [15] — but "gross" counts every share bought back before netting the stock issued to employees. Stock-based compensation ran $317.8 million in 2025 (Cash Quality), and offsetting that dilution absorbs a meaningful slice of the repurchase budget each year. The 18% decline in the audited diluted count is what actually accrues to a shareholder; it is real, but it is not 31%.
The price paid tells a less flattering story
The completed $4-billion authorization repurchased 43.7 million shares at an average price of $91 — close to where the stock trades today [16]. Taken alone that looks disciplined. But the average is anchored by cheap buying in 2022 and 2023; at the margin, the most recent large tranches were done at much higher prices. GoDaddy used accelerated share repurchase agreements to buy 1.4 million shares at $139.65 in 2024 and 4.4 million shares at $176.02 in 2025 [17]. The 2025 ASRs deployed the final $767.4 million of the old authorization in the first quarter, settling in April 2025 just before the shares began their slide toward $89 [18].
Sources: FY2025 10-K equity note (2024 and 2025 ASRs) [19]; Q1 2025 deck ($4B program average) [20]; Q3 2025 10-Q (9-month open-market) [21]; Q1 2026 10-Q [22].
The pattern in that table is the concern. Repurchase intensity did not fall as the price rose — it climbed. 2024, when the stock spent much of the year in the $100s, was the lightest recent buyback year at $676.5 million [23]; 2025, which opened near the peak, was the heaviest at $1,601.9 million. Buying 8.6 million shares for $1,392.6 million across the first nine months of 2025 — an average near $162 — was money spent close to the top [24]. This is the honest answer to whether management exploits a depressed price to shrink the count: it shrinks the count reliably, but through 2025 it deployed capital mechanically, roughly in line with cash generation, rather than leaning in when the stock was cheap.
The most recent data point cuts the other way. In the first quarter of 2026, with the shares near their lows, GoDaddy bought 3.0 million shares for $279.7 million — an average of about $93 [25]. That is the first large tranche in two years bought at a price a value buyer would welcome, and it is what makes the read forward-looking rather than settled.
Funded by cash, not leverage
Whatever one thinks of the timing, the buybacks have not been financed by stretching the balance sheet. GoDaddy issued no new term loans in 2025 and repaid $24.6 million; the entire $1.6 billion of repurchases came out of the year's operating cash flow, and financing outflows ($1,587.1 million) tracked the buyback almost exactly [26]. Net debt has held near $2.7 billion — about 1.7 times free cash flow (Cash Quality) — so the return of capital has not raised leverage. There is no dividend: the company has never paid one and does not intend to, leaving repurchases as the sole channel for returning cash [27]. For an investor who will tolerate modest leverage when the cash yield is high, that combination — self-funded buybacks, stable net debt, no dividend obligation — is the right structure.
The read
Management's intent is not in doubt. It reauthorized $3 billion of repurchases through 2027 in April 2025, calling it a reflection of "enduring confidence" in the business [28], and $1,885.5 million of that authorization remained available at the end of the first quarter of 2026 [29]. GoDaddy is a committed, count-shrinking allocator that returns nearly all of its free cash flow and funds it without leverage — which, at a free-cash-flow yield near 10%, is accretive per share almost regardless of entry price.
The weaker point is execution. Through 2025 the company bought on a schedule set by cash generation rather than by valuation, and it completed a program at $176 months before the stock halved. That is a real mark against the "exploits weakness" version of the buyback case, and it is the strongest fact a bull on capital allocation has to concede. What would change the read is simple to watch: whether the remaining $1.9 billion authorization is deployed harder at today's prices than it was at last year's. The first quarter of 2026, at roughly $93 a share, is a step in that direction; whether the next two quarters are deployed at similar prices is the record to watch.
Promise and Delivery
The case for owning GoDaddy is a bet that management keeps compounding cash. That makes their track record on their own targets a piece of evidence, not a footnote. The record is specific: in the three-year plan that has already run its course, GoDaddy missed the top-line growth number it set and hit or beat every cash and margin number. The current plan is tracking the same way — cash and margin ahead of target, revenue growth at the low end. Pay and insider behavior line up with that reading.
The completed cycle: 2022 through 2024
At a February 2022 investor day, GoDaddy gave the market a set of three-year financial targets for 2022 through 2024 — the first time it framed the business around the Applications & Commerce and Core Platform pillars and around cash rather than revenue [1]. By the 2024 investor day, management published a scorecard against those targets [2]. It is worth reading closely, because it is not a clean sweep.
Source: GoDaddy 2024 Investor Day, "On track to meet 2022 profitability and cash flow goals" [3].
Revenue was the number GoDaddy set and did not reach. It targeted a 10%-plus compound growth rate and delivered roughly 6% [4]. Everything downstream of revenue landed on or above plan: the normalized EBITDA margin ran from 25% to 29% against a 24%-to-26% target, cumulative unlevered free cash flow hit the ~$3.8 billion goal on the nose, and free cash flow per share compounded at about 22% to reach roughly $9.00 in 2024 against an $8.75 marker [5].
The shortfall and the beats have the same root. GoDaddy chose to grow revenue more slowly than it first hoped, and to convert what growth it had into margin and per-share cash at a rate above plan — the mix shift toward higher-margin Applications & Commerce, the pricing over units, and the buyback shrinking the share count. Management did not so much miss a target as reprioritize which target mattered, and delivered on the one it kept.
The current cycle: the 2024 North Star
The plan running now was set at the March 2024 investor day and reframed the goal explicitly as free cash flow per share. Its three anchors for 2024 through 2026 are 6%-to-8% annual revenue growth, a 2026 normalized EBITDA margin of about 33%, and $4.5 billion-plus of cumulative free cash flow [6].
Two years in, the cash and margin lines are ahead. In 2024, GoDaddy reported revenue up 8%, operating cash flow up 23% at a 31% margin, free cash flow of $1.4 billion up 25%, and its first $5 billion of annual bookings [7]. In 2025, revenue reached $5.0 billion up 8%, bookings $5.4 billion, normalized EBITDA $1.6 billion up 14% at a 32% margin, and free cash flow $1.6 billion up 19% [8]. For 2026, guidance is 6% revenue growth at the midpoint, a normalized EBITDA margin over 33%, and free cash flow of about $1.8 billion [9].
Source: 2024/2025 free cash flow as reported [10] [11]; 2026 guidance [12]; target [13].
Adding the 2024 and 2025 results to the 2026 guide puts cumulative free cash flow near $4.8 billion, above the $4.5 billion floor with a year still to run — which is why the October 2025 deck describes the plan as "on track to exceed" its target [14]. The margin anchor is tracking too: 31% in 2024, 32% in 2025, and guided above 33% for 2026 [15] [16] [17].
Source: 2024/2025 growth as reported [18] [19]; 2026 guidance midpoint [20].
Revenue is again the softest line. Growth held at the top of the 6%-to-8% band in 2024 and 2025, then the 2026 guide steps down to 6% at the midpoint — the bottom of the band, and the same deceleration the price has been reacting to. Management delivers the cash and margin it anchors on, and sets revenue at the ambitious end only to trim it later — the pattern that matters for a thesis leaning on cash a decade out.
Pay follows the cash line, not the growth line
The compensation design has moved in step with the mix. For 2025, the committee cut the short-term incentive plan from four corporate metrics to two — bookings and normalized EBITDA, weighted equally — and dropped revenue and unlevered free cash flow [21]. One reading is housekeeping, aligning the bonus to the bookings-and-EBITDA framing management now leads with. Another is that the plan quietly retired revenue, the target it has twice set high and twice undershot. Both can be true; the effect is that no cash bonus now rides on the growth number.
The plan paid what the formula said. On 2025 results, bookings landed at target and normalized EBITDA above it, for a 113% corporate payout with, by the committee's account, no upward or downward discretion applied [22]. Long-term pay is half performance stock units that vest only on relative total shareholder return against the Nasdaq Internet Index over three years, half time-vesting stock [23] — so a portion of the CEO's realized pay is tied directly to how the stock does against peers, including the drawdown from its 2025 high to the mid-$70s.
CEO Base Salary ($M)
CEO 2025 LTIP Target ($M)
2025 STIP Payout
2025 Say-on-Pay Approval
Sources: base salary [24]; LTIP target [25]; STIP payout [26]; say-on-pay [27].
The structure is shareholder-friendly on its face. The CEO's base salary has been fixed at $1.0 million since he joined in 2019, so the pay that moves is the variable, performance-linked part [28]. Shareholders endorsed it: the 2025 say-on-pay vote passed with 92.4% support [29]. A tension worth naming: after 2024 delivered revenue up 8% and free cash flow up 25%, the committee raised the CEO's long-term award to a $20 million target, so pay rose into the same window the share price fell [30] — though the relative-return vesting condition means the grant only pays out fully if the stock earns it against peers.
Skin in the game runs one way
Alignment through pay design is real; alignment through open-market conviction is absent. Across 146 insider transactions on record, every open-market trade by an officer or director is a sale — about 377,000 shares for roughly $57 million — with no open-market purchases at all, including through the drawdown to the mid-$70s. The heaviest selling, near $41 million, came in 2025, the year the stock touched its $215 high.
Source: SEC Form 4 filings (EDGAR), open-market sales through July 2026; no open-market purchases recorded.
This is the softer kind of signal. A majority of the sales — 64 of 113 — ran under pre-set 10b5-1 plans, and executives holding stock through vesting rather than buying more is ordinary, not a tell. But the direction is worth stating plainly: the people closest to the numbers have been sellers into strength and non-buyers into weakness, so the conviction on display is the compensation committee's design, not cash out of executives' own pockets at today's price.
What would change the read
On the evidence, management's word is good where it counts most for the thesis — the cash and margin targets that anchor the free-cash-flow-per-share story have been met or beaten across two consecutive multi-year plans — and weaker on the growth targets it keeps setting high and trimming later. The pay plan reinforces exactly that emphasis, and shareholders have blessed it. The read would weaken if GoDaddy missed a free cash flow or NEBITDA target rather than a revenue one, if the committee began paying out above the formula through discretion, or if the 2026 revenue guide slipped below the 6% floor of its own band — the first sign that the growth it under-promises is starting to under-deliver as well.
Price and Tradability
GoDaddy trades near $89, about 58% below its early-2025 peak of roughly $215. The market cut GoDaddy's equity value by about 60% while its free cash flow rose roughly a quarter and 2026 free cash flow is guided higher still, compressing the multiple from about 25 times free cash flow to under 8 — a re-rating of the price, not a downgrade of the cash [1]. The stock and its long-dated options are liquid.
Earlier chapters established the cash and its quality (Domains and Cash Flow, Cash Quality). This one is about the other side of the trade: what the market did to the price, why, and whether the security clears a value investor's practical filters for acting on it.
The de-rating in numbers
The compression is almost entirely in the multiple, not the cash. Over the same window that took equity value from about $31 billion to $12.5 billion, trailing free cash flow rose from $1.26 billion (FY2024) to $1.58 billion (FY2025), and management guides 2026 free cash flow to roughly $1.8 billion [2].
Source: derived from reported financials (free cash flow) and month-end prices; peak share count 145.3M, latest 140.6M [3].
Put in levels, the two dates look like different companies wearing the same cash flows:
Source: derived from reported financials and prices; free cash flow per FY2025 results [4]; trailing EPS $6.22 (FY2025), forward multiple ~12.5x on $7.11 consensus.
This is the pattern a value investor watches for: a market-value drawdown far larger than any change in the underlying cash. Free cash flow yield went from 4% — a price at which the business was being valued for growth it does not deliver — to 12.6%, comfortably inside this reader's 10% preference. Part of the fall is a rational re-rating rather than an overshoot: the 2026 revenue guide implies only about 6% growth [5], fourth-quarter bookings grew just 5% [6], and the 10-K names AI as a risk that could eliminate the need to register a domain [7] — a business growing that slowly with genuine terminal risk can deserve 8 times free cash flow rather than 25. Whether the fall is a mispricing or a correctly-priced slower business is what the rest of this report weighs; the arithmetic here only establishes that the price moved, and the cash did not move with it.
The round trip
The share price more than doubled between January 2024 and February 2025, from about $103 to an all-time high of $214.99, then gave almost all of it back over the following seventeen months to a low of $74 and a recent $88.92.
Source: daily price series, month-end closes, as reported.
The run-up had identifiable fuel. GoDaddy joined the S&P 500 in June 2024, forcing index buying; it launched its Airo AI assistant in early 2024; and margins were expanding. By February 2025 the stock changed hands at roughly 33 times trailing earnings and 25 times free cash flow — a growth multiple. What followed was the market re-rating that multiple back toward a mid-single-digit grower, and the give-back has been a grind rather than a crash: no single session did most of the damage.
What the market re-priced
Three things pushed the multiple down, in roughly ascending order of substance.
Growth deceleration made explicit. With its February 2026 results GoDaddy guided 2026 revenue to $5.195–$5.275 billion, about 6% growth at the midpoint, and 2026 free cash flow to roughly $1.8 billion [8]. A ~6% top line is hard to hold at 25 times cash flow, and the guide crystallised what the price had been drifting toward all year.
A bookings figure that read worse than it was. Fourth-quarter total bookings grew only 5% to $1,283.2 million, against full-year bookings up 7.2% to $5,400.0 million [9] [10]. The softness was partly self-inflicted and partly optical: GoDaddy ran a promotional one-year .com offer to widen the top of the funnel, and "the demand for this offer was greater than we expected," so a shift in term mix toward one-year contracts "reduced upfront bookings and near-term revenue" [11]. Because bookings are paid in advance, moving customers from three-year to one-year terms lowers the cash collected up front without changing the revenue GoDaddy recognises — an accounting-timing drag, not lost demand. Management also flagged that the expiration of the .CO registry contract and the exclusion of high-value aftermarket transactions account for about two-thirds of a roughly 200-basis-point revenue headwind in 2026, the promotional shift the other third [12].
The AI question, cutting both ways. GoDaddy's own 10-K names the risk plainly: widespread acceptance of "AI-powered products and tools or closed networks" could "eliminate the need to register a domain name or to establish an online presence" [13]. The same technology the 2024 rally treated as a tailwind (Airo) became, in the de-rating, a threat to the domain funnel that anchors the franchise. Slow visible monetisation of Airo compounded the concern, and analysts moved with it — price-target cuts through late 2025 and early 2026 took several targets from the $130–$145 range down toward $90–$105.
What the market conspicuously did not do is cut the numbers. Consensus 2026 revenue sits near $5.24 billion and 2027 near $5.55 billion; the 2026 earnings estimate has edged up over the past ninety days, not down, and the average analyst price target of about $112 sits well above the $89 price. The de-rating happened while forward estimates held — the definition of a multiple story rather than an earnings story.
Tradability and options
This reader will only hold names with liquid, at-the-money, long-dated options. GoDaddy clears that filter at both levels.
The underlying is a highly liquid large cap. Twenty-day average dollar volume is about $211 million a day on roughly 2.6 million shares, annual share turnover runs above 600% of the float, the median daily trading range is about 1.4%, and there were zero zero-volume days over the past sixty sessions. A position worth 1% of the market capitalisation — about $71 million — could be exited in roughly two to four trading days without dominating the tape.
20-Day Avg Daily Volume ($M)
Annual Share Turnover (%)
30-Day Implied Volatility (%)
Source: exchange price and options data, as reported (market data, July 2026).
On the options themselves: GoDaddy carries listed calls and puts with LEAPS extending to January 2028 — introduced in September 2025 — so the longest-dated series runs about two and a half years out, comfortably past the reader's one-year threshold. Near-term at-the-money implied volatility is around 47%, with a 52-week range of roughly 24% to 66% (the high struck near the April 2026 price trough); elevated versus a mega-cap, but ordinary for a de-rated mid-cap software name and a reflection of the same uncertainty that halved the stock. Total open interest is on the order of 25,000 contracts with a put/call open-interest ratio near 0.74.
One honest caveat sits inside the green light: open interest and depth concentrate in the front months, and long-dated LEAPS strikes trade with materially wider bid-ask spreads than the penny-wide equity. The name is liquid enough to build or hedge a long-dated position; a large one would still pay a spread to do it in size at the far expirations.
What would change the read
On the evidence, the fall reads as a de-rating driven by fear and disappointed growth expectations rather than by an impairment of the cash flows: equity value fell 60% while free cash flow rose and forward estimates held, which is the disconnect between price and cash-flow value that a patient buyer looks for. The strongest fact against treating it as a bargain is that a durably ~6%-growth business exposed to genuine AI-disruption risk may simply deserve 8 times free cash flow rather than 25 — in which case the multiple corrected rather than overshot. What would move the read is concrete: a re-acceleration of bookings and a return to customer growth, or visible Airo and Agent Name Service monetisation, would argue the market over-corrected; a further round of estimate cuts, or evidence that AI is actually shrinking the domain funnel, would argue it did not. Those catalysts and the year-ahead scenario band are where this report is naturally headed next.
Implied Growth
GoDaddy's headline 12.6% free-cash-flow yield shrinks to about 8.5% once stock comp and a normalized cash tax are charged against the $16.5 million of cash income tax it actually paid on $1,020 million of pretax profit, and at that burdened level the price implies owner cash flow grows only about -1% to +2% forever — a yield already priced for terminal stagnation rather than the clean double-digit bargain the headline suggests.[1] The near-term counter is that management guides 2026 free cash flow to about $1.8 billion, a roughly 14% forward yield, so the business is not yet in terminal decline [2]. This chapter cashes that burdened yield from the Cash Quality reconciliation, sets a ten-year revenue band, and names what would settle the debate.
Price (Jul 10, 2026)
Price / Reported FCF
FCF Yield (reported)
FCF Yield (burdened)
Sources: reported cash flows, FY2025 10-K [3]; equity value and net debt as of July 10, 2026; burdened yield per the reconciliation in Cash Quality.
The de-rating that halved the shares was a collapse in the multiple, not the cash (Price and Tradability). With the cash already established as real and high-quality in earlier chapters, the open item is the growth rate the market is now paying for — and at a 12.6% headline yield, the single-stage arithmetic below puts that at roughly -1% to +2% a year.
The multiple embeds terminal stagnation
A single-stage discount answers that cleanly. Held as a perpetuity, an equity value equals next year's owner cash flow divided by the required return less the constant growth rate — so the growth the price implies is simply the required return minus the free-cash-flow yield. The table runs that arithmetic across three definitions of owner cash flow and a range of required returns.
Source: derived from FY2025 cash flows [4] and equity value at July 10, 2026; single-stage growth model, implied g = required return − FCF yield.
Charge nothing and the price implies owner cash flow shrinking about 2-4% a year forever. Charge the $317.8 million of stock compensation the headline omits [5] and normalize the tax shield, and the range moves up to roughly flat — but the ceiling of the plausible grid, using the most conservative cash figure and an 11% required return, is only about +2.5% perpetual growth, below inflation — a price that leaves essentially no room for durable growth in owner cash flow.
That framing is generous to the bull, not the bear. The model credits growth as constant from year one; management actually guides 6% revenue growth for 2026 [6]. Front-loading several years of mid-single-digit growth leaves even less for the terminal period, so the true long-run rate the price bakes in is more negative than the single-stage figure. In plain terms: the market is paying for a business whose cash flow does not durably grow. Whether that is a rational read of an AI-exposed ~6% grower or an overshoot is the reconciliation the rest of this chapter works through.
The case, on one table
Both sides argue from the same facts. The disagreement is about which way each fact resolves, and — usefully — most of the disputes are checkable against future filings rather than a matter of taste.
Sources: FY2025 10-K key metrics [7] and AI risk factor [8]; share-repurchase disclosure [9].
The bull's strongest evidence is that the pricing engine has already compounded through the first three years of generative AI: average revenue per customer rose from $203 (FY2023) to $242 (FY2025) while retention held near 85% and more than 89% of revenue came from prior-year customers [10]. The bear's strongest evidence is the company's own words: GoDaddy's risk factors state that AI-powered tools could eliminate the need to register a domain [11], and the growth that remains now rests entirely on that pricing lever, because the unit base is shrinking (Moat and Durability). Neither side is refuted today; the deciding evidence arrives quarter by quarter in the metrics below.
Ten years out: how much has to go wrong
The reader's standing question is direct — can one say, with high confidence, that revenue a decade from now is higher than today. The arithmetic makes the bar visible. FY2025 revenue was $4,951 million [12]. For it to be lower in FY2035, revenue has to fall on average for ten straight years.
Source: FY2025 revenue as reported [13]; scenario paths derived (bear -2%, base +5%, bull +7% annual growth).
The three paths bracket the range. The base case (+5% a year, near consensus of ~5.9% for 2026 and 2027 decaying gently) reaches about $8.1 billion. The bull case (+7%, the top of management's 6-8% North Star sustained [14]) reaches about $9.7 billion. The bear case drawn here is not a stall but a genuine decline of 2% a year — and even that only pulls FY2035 revenue down to about $4.0 billion, marginally below today. A flat decade (0% growth) lands exactly at today's revenue; anything above zero clears the bar.
So the honest answer to the ten-year question is yes, with roughly 90% confidence, and the reason is structural: with retention near 85% and more than 89% of revenue recurring from existing customers, revenue falls only if pricing power reverses and the unit base keeps eroding, together, for years. That is a real scenario — it is the AI-disintermediation tail the 10-K names — but it is a tail, not the central path, and it is what the residual ~10% of doubt represents. The confidence attaches to revenue direction. Free-cash-flow-per-share being higher is a slightly harder claim: the depleting tax shield adds a $150-200 million eventual drag (Cash Quality) and stock-based dilution must be repurchased before the share count falls (Capital Allocation) — though buybacks at 8x free cash flow work hard in the base and bull paths.
What would settle it
Each dispute in the bull/bear table has a line item that moves it. These are checkable in the next few filings, and each carries a threshold that would change the read.
Sources: 2026 outlook and modeling guide [15]; FY2025 key metrics [16]; Q1 2026 repurchases [17].
The market's own scorecard sits above the price. Sixteen analysts split eight holds against eight buys or better, with no sells; the average price target is about $112 and the median $100, against the $88.92 quote — a gap that reflects a multiple debate, not an earnings one, since 2026 consensus revenue and earnings have barely moved through the drawdown. The reconciliation of this report is that the cash is real and high-quality, the franchise is sticky and still lifting price and margin, and the buyback compounds hard at these levels — set against a genuine, company-acknowledged AI risk to the domain anchor and a growth rate that has stepped down to mid-single digits. The price has resolved that tension toward the bear. The watch items above are where a reader can check, filing by filing, whether that resolution holds — whether, a decade out, this franchise's free cash flow is reliably higher.
Consensus figures: analyst estimates as compiled July 2026; not drawn from the filings corpus.